← return to practice.dsc80.com
Instructor(s): Suraj Rampure
This exam was administered in-person. The exam was closed-notes, except students were allowed to bring a single two-sided notes sheet. No calculators were allowed. Students had 80 minutes to take this exam.
In this exam, we’ll work with the DataFrame dogs, which
contains one row for every registered pet dog in Zurich, Switzerland in
2017.
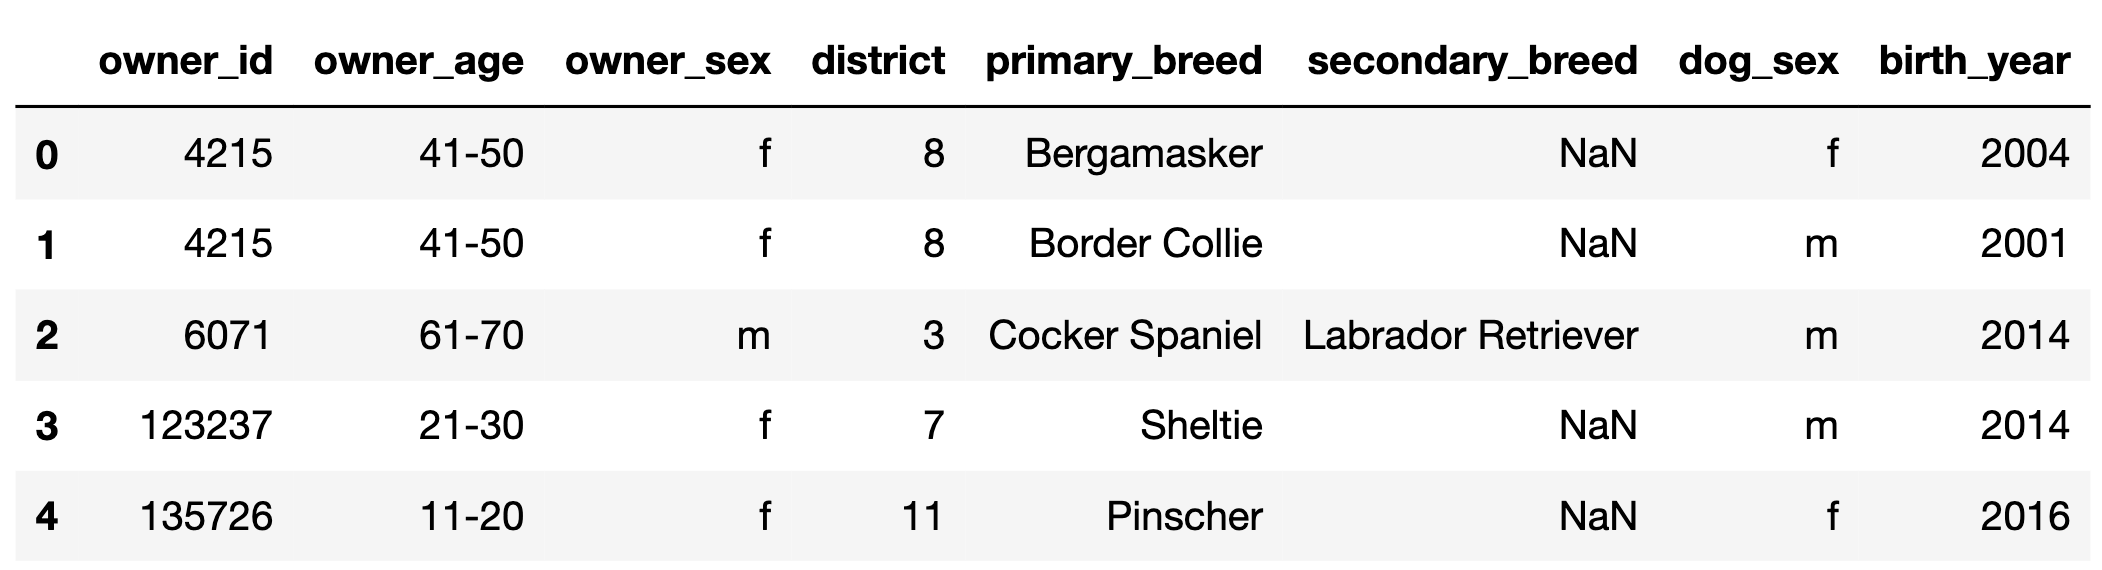
The first few rows of dogs are shown below, but
dogs has many more rows than are shown.
"owner_id" (int): A unique ID for each owner. Note
that, for example, there are two rows in the preview for
4215, meaning that owner has at least 2 dogs.
Assume that if an "owner_id" appears in
dogs multiple times, the corresponding
"owner_age", "owner_sex", and
"district" are always the same."owner_age" (str): The age group of the owner; either
"11-20", "21-30", …, or "91-100"
(9 possibilities in total)."owner_sex" (str): The birth sex of the owner; either
"m" (male) or "f" (female)."district" (int): The city district the owner lives in;
a positive integer between 1 and 12
(inclusive)."primary_breed" (str): The primary breed of the
dog."secondary_breed" (str): The secondary breed of the
dog. If this column is not null, the dog is a “mixed breed” dog;
otherwise, the dog is a “purebred” dog."dog_sex" (str): The birth sex of the dog; either
"m" (male) or "f" (female)."birth_year" (int): The birth year of the dog.Throughout the exam, assume we have already run
import pandas as pd and
import numpy as np.
Only one of the following variables is of a numerical feature type; the rest are categorical. Which one is it?
"owner_id"
"owner_age"
"district"
"dog_sex"
"birth_year"
Answer: "birth_year"
Some of the other columns may be stored as numbers, like
'"district", but they are not numerical – you can’t do
arithmetic with them. "birth_year" is the only column on
which arithmetic operations are well-defined, making it numerical.
Many students answered "owner_age", but the values in
"owner_age" are age categories, not actual ages.
"district" is incorrect because districts are nominal
categories, like phone numbers, zip codes, and Social Security
Numbers.
The average score on this problem was 76%.
Suppose "21-30" is the most common value in the
"owner_age" column. Just for this part, suppose we also
have access to a "owner_age_years" column that contains the
actual age of each owner in years, e.g. 36 instead of
"31-40".
True or False: The most common value in the
"owner_age_years" column must be between 21
and 30, inclusive.
True
False
Answer: It could be the case that 21-30 is the most common age category, but 33 is the single most common age. What if everyone in the 31-40 age category is aged 33, but everyone in the 21-30 age category is “spaced out”?
The average score on this problem was 71%.
Fill in the blank so that most_common evaluates to the
most common district in dogs. Assume there are no ties.
most_common = ____Answer:
dogs["district"].value_counts().idxmax()Above, we presented one possible solution, but there are many:
dogs["district"].value_counts().idxmax()dogs["district"].value_counts().index[0]dogs.groupby("district").size().sort_values(ascending=False).index[0]dogs.groupby("district").count()["owner_id"].sort_values(ascending=False).index[0]
The average score on this problem was 72%.
Fill in the blank so that female_breeds evaluates to a
Series containing the primary breeds of all female dogs.
female_breeds = dogs.____Answer:
loc[dogs["dog_sex"] == "f", "primary_breed"]Another possible answer is:
``py query("dog_sex == 'f'")["primary_breed"]
Note that the question didn’t ask for unique primary breeds.
The average score on this problem was 79%.
Fill in the blank so that midpoints evaluates to a
Series that contains the midpoint of each dog owner’s age group as a
float. For example, the midpoint of the age group "51-60"
is 55.5. Your answer must fit on one line, and cannot use
the def keyword.
midpoints = dogs["owner_age"].____Answer:
str.split("-").str[0].astype(float) + 4.5There are many possible solutions. Many students tried to average the two numbers, which is correct:
apply(lambda x: 0.5 * (int(x.split("-")[0]) + int(x.split("-")[1])))However, we thought it’s much easier to just add 4.5 to the first number (which is what the “answer” presented does), or even concatenate the first digit with the string “5.5” – these are all equivalent to the midpoint.
The average score on this problem was 68%.
Gabriel owns 3 dogs with a primary breed of "Beagle". No
other owner has more than 2 "Beagle"s.
Fill in the blanks so that gabriels_district evaluates
to the district that Gabriel lives in.
gabriels_district = (
    dogs.__(i)__
    .agg({"district": __(ii)__,
            "primary_breed": lambda x: __(iii)__})
    .sort_values("primary_breed")
    ["district"]
    .__(iv)__
)
What goes in the blanks?
Answer:
groupby("owner_id"). The idea is to condense the
DataFrame into one row per "owner_id" such that we know the
number of "Beagle"s that each owner has. Since Gabriel has
the most "Beagle"s, if we can sort by number of
"Beagle"s, Gabriel will be at the bottom (if we sort in
increasing order).max, min, mean, or
median (among other possibilities). Since all of the
"district" rows for a particular "owner_id"
are going to be the same, essentially any aggregation method that takes
in a Series of identical district numbers – like
[3, 3, 3, 3] – and returns the number will work.x, and
return the number of elements in the Series that are the string
"Beagle". One possible solution is:
py (x == "Beagle").sum()iloc[-1]. Since we’re sorting by number of
"Beagle"s in increasing order, Gabriel will be at the
bottom.
The average score on this problem was 63%.
Jasmine is a veterinarian. Below, you’ll find information about some of the dogs in her care, separated by district and breed.
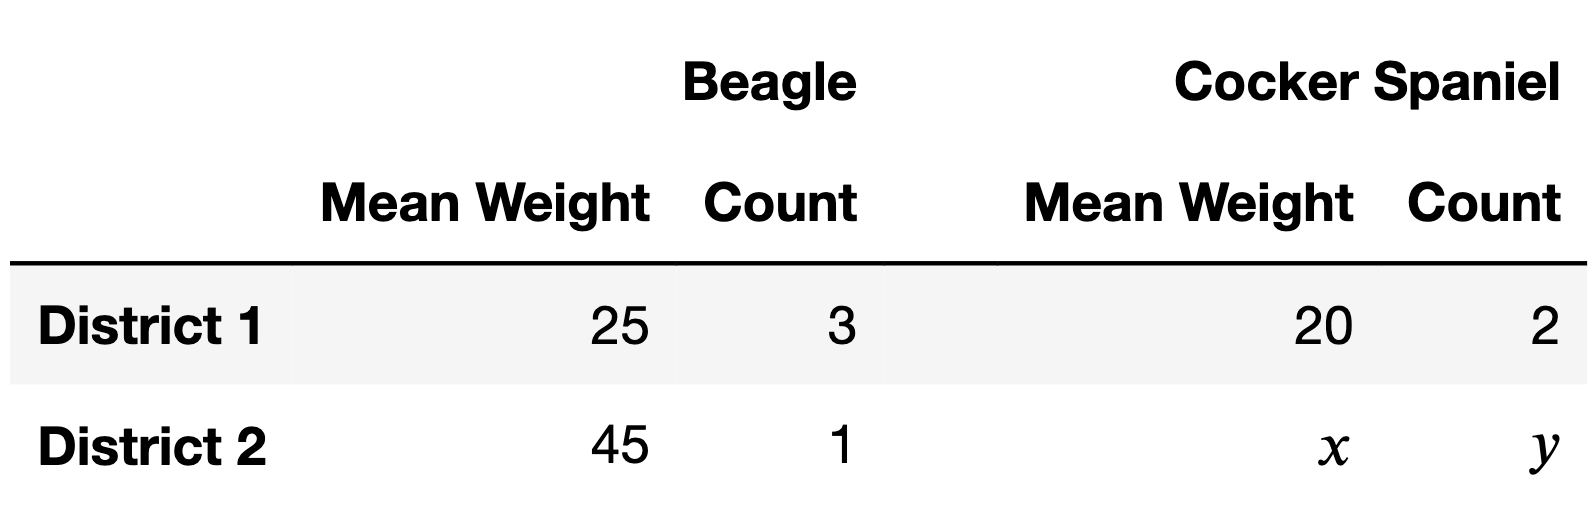
What is the mean weight of all beagles in the table above, across both districts? Give your answer as a positive integer.
Answer: 30
This is a weighted mean:
\frac{25 \cdot 3 + 45 \cdot 1}{3 + 1} = \frac{120}{4} = 30
The average score on this problem was 91%.
Notice that the table above has two unknowns, x and y. Find positive integers x and y such that the mean weight of all beagles is equal to the mean weight of all cocker spaniels, where x is as small as possible.
Answer: x = 31, y = 20
The mean weight for all beagles is 30. Since the mean weight for cocker spaniels in District 1 is below 30 (it’s 20), the mean weight for cocker spaniels in District 2 needs to be above 30 so that it’s possible for the mean weight for all cocker spaniels to match the mean weight of all beagles. The smallest x that allows us to match the mean weight, then, is the smallest integer greater than 30, which is 31.
Once we establish that we’re going to use x = 31, this becomes an algebra problem.
\begin{align*}\frac{20 \cdot 2 + 31y}{2 + y} &= 30 \\ \implies 40 + 31y &= 60 + 30y \\ \implies y &= 20 \end{align*}
The average score on this problem was 51%.
There are two possible ways in which Simpson’s paradox could appear in the table above:
Is it possible to pick positive integer values of x and y such that both ways of Simpson’s paradox mentioned above occur at the same time?
Yes, it’s possible.
No, it’s not possible.
Answer: No, it’s not possible.
In the first part, we already established that we need x \geq 31 in order for the mean weight of all cocker spaniels to be greater than the mean weight of all beagles. But if x = 31, then the mean weight of all district 2 dogs has to be somewhere between 31 and 45, which no matter what, is going to be bigger than the mean weight of all district 1 dogs, which is 23. This means that we can’t have Simpson’s paradox both ways.
The average score on this problem was 59%.
The DataFrame observed_counts, shown in its entirety
below, describes the number of dogs with each combination of owner sex
and dog sex in dogs.
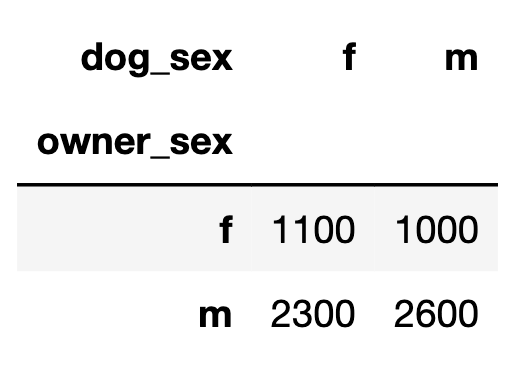
For instance, there are 2300 dogs that are female and have a male owner.
Consider the following two hypotheses. - Null Hypothesis: The distribution of dog sex for female owners is equal to the distribution of dog sex for male owners. - Alternative Hypothesis: The distribution of dog sex for female owners is not equal to the distribution of dog sex for male owners.
Suppose counts is a DataFrame with the same format as
observed_counts containing a simulated sample drawn under
the null hypothesis.
col_norm = counts / counts.sum()
stat1 = col_norm.diff().abs().iloc[1, 0]
stat2 = col_norm.diff(axis=1).abs().iloc[0, 1]
stat3 = col_norm.diff(axis=1).abs().iloc[:, 1].sum() / 2

row_norm = counts.apply(lambda s: s / s.sum(), axis=1)
stat4 = row_norm.diff().abs().iloc[1, 0]
stat5 = row_norm.diff(axis=1).abs().iloc[0, 1]
stat6 = row_norm.diff(axis=1).abs().iloc[:, 1].sum() / 2
Which of the variables defined above are valid test statistics for these two hypotheses? Select all that apply.
stat1
stat2
stat3
stat4
stat5
stat6
Answer: stat4 only
Note that here, we’re comparing the rows of
counts. To turn each row into a valid distribution that
sums to 1, we need to divide each row by the sum of itself. That means
that none of stat1, stat2, nor
stat3 work for these two hypotheses, since these three
statistics have columns that add to 1, not rows.
stat4 is the option that works for these two hypotheses.
It normalizes the rows so that they sum to 1, and then finds the
absolute difference in proportions between the proportion of female dogs
in both groups. Remember that when there are only two categories, the
TVD is equal to the absolute difference in proportions for one of the
categories!
stat5 doesn’t work because it tries to subtract elements
in the same distribution from one another, whereas the goal is to
compare the corresponding proportions in different distributions.
The average score on this problem was 63%.
Now, consider the following two hypotheses.
Which of the variables from part (a) above are valid test statistics for these two hypotheses? Select all that apply.
stat1
stat2
stat3
stat4
stat5
stat6
Answer: stat2 and
stat3
See above.
The average score on this problem was 65%.
For your convenience, we show observed_counts again
below.
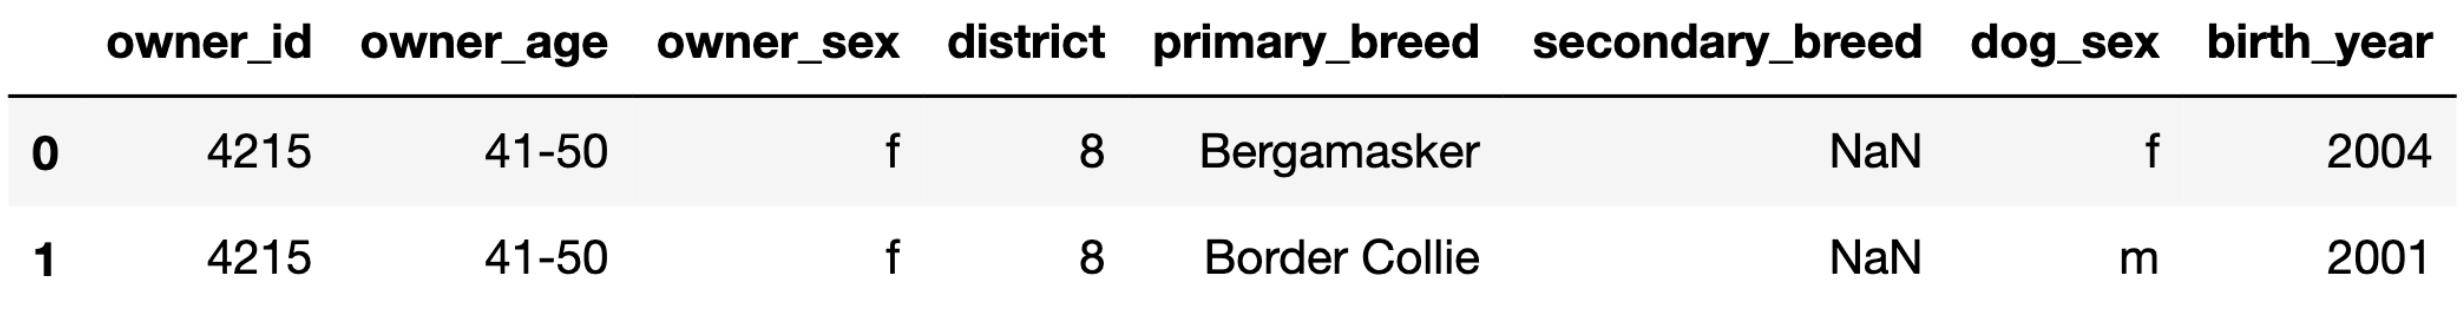
A “matching pairing” is a combination of dog and owner that both have the same sex. For example, the first row in the DataFrame below is a matching pairing, while the second is a non-matching pairing.
Now, consider the following pair of hypotheses.
Suppose we choose the following test statistic.
def test_stat(counts):
    s = counts / counts.sum().sum()
return 1 - 2 * (s.iloc[0, 1] + s.iloc[1, 0])test_stat(observed_counts) evaluate to? Give your answer as
a simplified fraction.stats. Furthermore,
suppose obs is the observed statistic you found above.
Which of the following correctly computes the p-value for our test? (stats >= obs).mean()
(stats > obs).mean()
(stats <= obs).mean()
(stats < obs).mean()
Answer: (i): \frac{2}{35}, (ii):
(stats >= obs).mean()
To understand the answer to (i), we need to understand what
test_stat is computing. Since
counts.sum().sum() is the total number of entries in
counts – 7000 in observed_counts, for instance
– s is a version of counts where all of the numbers are
turned into proportions out of the overall total. Then,
s.iloc[0, 1] + s.iloc[1, 0] is the proportion of pairings
that are non-matching.
So, to compute this numerically, we have 1 - 2 \cdot \left( \frac{23}{70} + \frac{10}{70} \right) = 1 - 2 \cdot \frac{33}{70} = 1 - \frac{66}{70} = \frac{4}{70} = \frac{2}{35}
Note that 1 - 2 * (s.iloc[0, 1] + s.iloc[1, 0]) ends up
simplifying to
s.iloc[0, 0] + s.iloc[1, 1] - (s.iloc[0, 1] + s.iloc[1, 0]),
which means in words, the test statistic is the difference
between the proportion of matching pairings and non-matching
pairings.
When the difference in proportions (matching minus non-matching) is
large, it means there are more matching pairings than non-matching
pairings. Our alternative hypothesis is that there are more matching
pairings, so we look at the proportion of simulated statistics that are
at least as large as our observed, hence >=.
The average score on this problem was 65%.
Select the true statement below.
The tests in parts 4.1, 4.2, and 4.3 are all standard hypothesis tests.
The tests in parts 4.1, 4.2, and 4.3 are all permutation tests.
The tests in parts 4.1 and 4.2 are standard hypothesis tests, while the test in part 4.3 is a permutation test.
The tests in parts 4.1 and 4.2 are permutation tests, while the test in part 4.3 is a standard hypothesis test.
Answer: The tests in parts 4.1 and 4.2 are permutation tests, while the test in part 4.3 is a standard hypothesis test.
In 4.1 and 4.2, we were testing whether two sample distributions
appeared to be drawn from the same population distribution, and in 4.3,
we were testing whether a sample distribution (the distribution of
matching vs. non-matching) was drawn from a specified population
distribution ([0.5, 0.5]). Think of 4.3 like a standard
coin-flipping example from Lecture 6.
The average score on this problem was 46%.
In this question only, assume that there are more than 12 districts
in dogs.
Suppose we merge the dogs DataFrame with itself as
follows.
# on="x" is the same as specifying both left_on="x" and right_on="x".
double = dogs.merge(dogs, on="district")

# sort_index sorts a Series in increasing order of its index.
square = double["district"].value_counts().value_counts().sort_index()
The first few rows of square are shown below.
1     5500
4      215
9 40In dogs, there are 12 rows with a
"district" of 8. How many rows of
double have a "district" of 8?
Give your answer as a positive integer.
Answer: 144
When we merge dogs with dogs on
"district", each 8 in the first
dogs DataFrame will be combined with each 8 in
the second dogs DataFrame. Since there are 12 in the first
and 12 in the second, there are 12 \cdot 12 =
144 combinations.
The average score on this problem was 49%.
What does the following expression evaluate to? Give your answer as a positive integer.
dogs.groupby("district").filter(lambda df: df.shape[0] == 3).shape[0]Hint: Unlike in 5.1, your answer to 5.2 depends on the values in
square.
Answer: 120
square is telling us that: - There are 5500 districts
that appeared just 1x in dogs. - There are 215 districts
that appeared 2x in dogs (2x, not 4x, because of the logic
explained in the 5a rubric item). - There are 40 districts that appeared
3x in dogs.
The expression given in this question is keeping all of the rows corresponding to districts that appear 3 times. There are 40 districts that appear 3 times. So, the total number of rows in this DataFrame is 40 \cdot 3 = 120.
The average score on this problem was 16%.
What is the most likely missingness mechanism of the
"secondary_breed" column in dogs?
Missing by design
Not missing at random
Missing at random
Missing completely at random
Answer: Anything other than MCAR
The original answer we had in mind was missing by design. Secondary breeds are missing for purebred dogs – that is, dogs that don’t have a secondary breed. There is nothing you could “fill in” here.
However, you can make reasonable arguments for both MAR and NMAR, so we’ll give those answers full credit too. For instance, one could argue that certain breeds are less likely to be mixed with other breeds, so the missingness is dependent on primary breed.
The average score on this problem was 92%.
Using the "birth_years" column in dogs,
Yutian computes the age of each dog and stores it in the
"age" column of dogs. She also categorizes
dogs into three “breed classes" based on their primary breed –
"Retriever", "Terrier", or
"Other" – and stores these in the "class"
column of dogs.
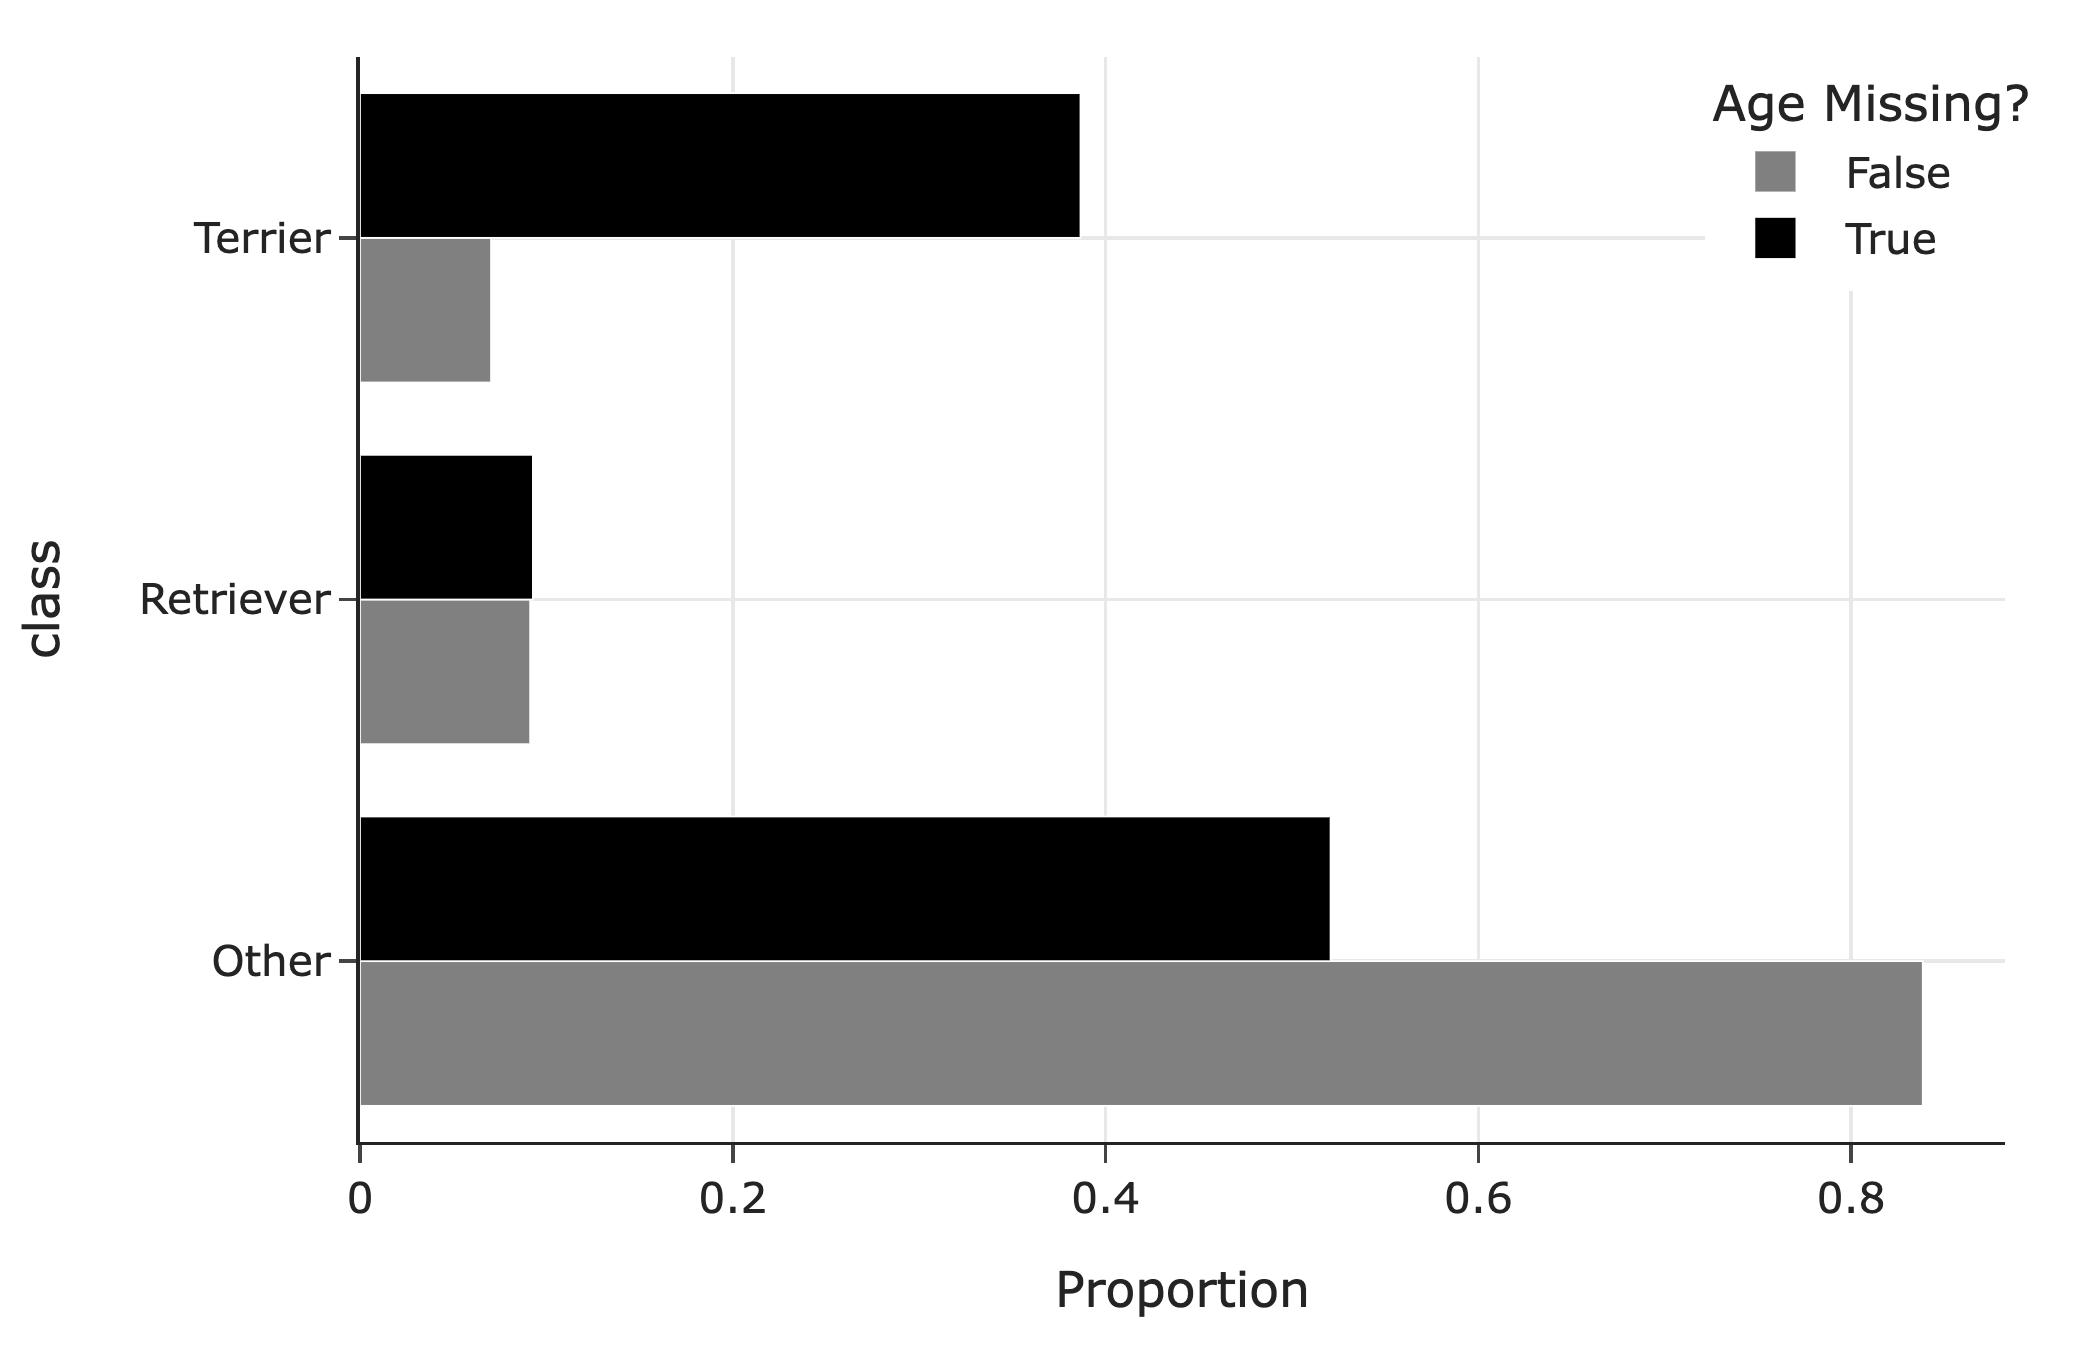
The following bar chart shows the distribution of breed classes by missingness of age:
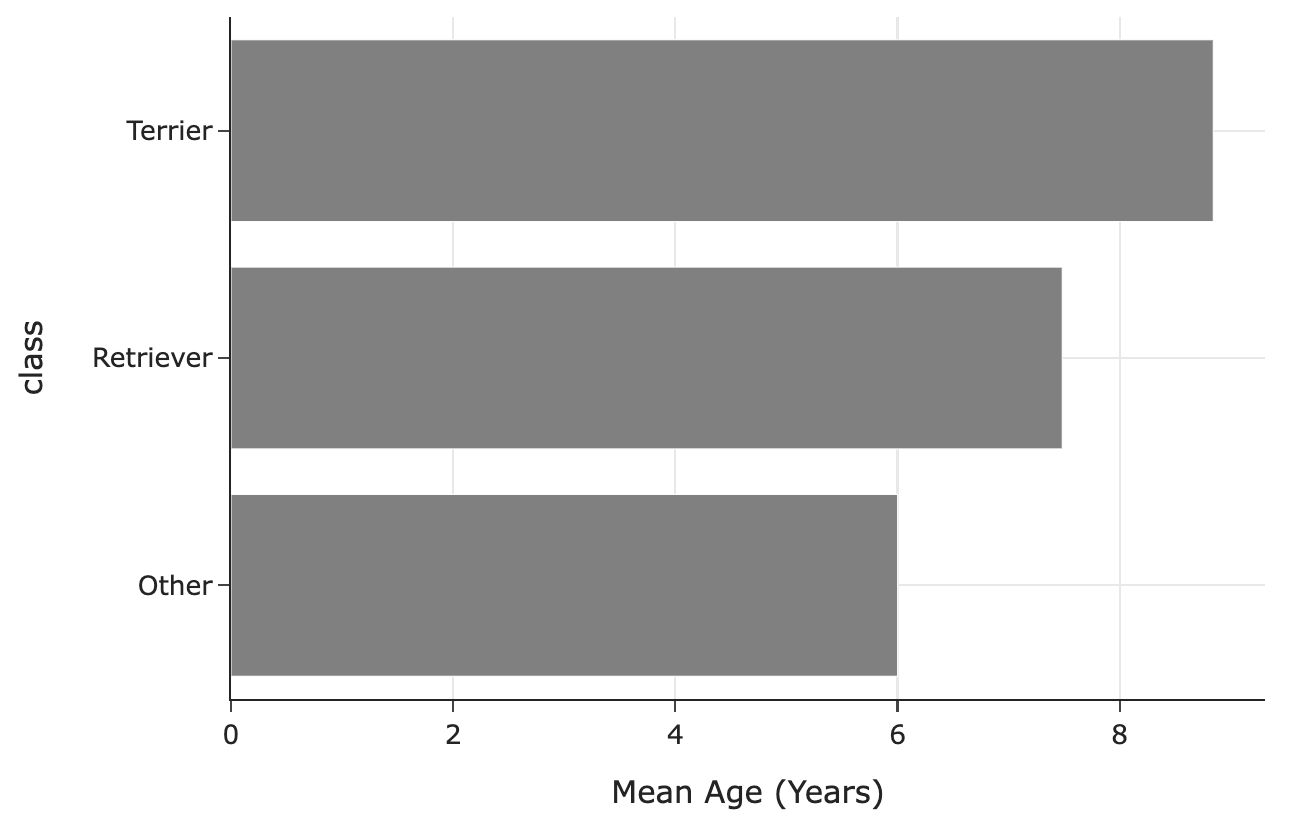
The following bar chart shows the mean observed age for each breed class:
What is the most likely missingness mechanism of ages?
Missing by design
Not missing at random
Missing at random
Missing completely at random
Answer: Missing at random
The distributions of breed classes look quite different when age is missing vs. when age is not missing. Hence, the missingness of ages likely depends on breed classes.
The average score on this problem was 86%.
Name a test statistic we could use to perform a statistical test to assess whether the missingness of ages depends on breed classes.
Answer: Total variation distance
Breed class is a categorical variable, and hence its distribution is categorical. The tool we have for comparing categorical distributions (in this case, the distribution of breed class when age is missing vs. the distribution of breed class when age is not missing) is the TVD.
The average score on this problem was 47%.
Let O be the mean of the observed
ages in dogs, that is, the mean of the ages that aren’t
missing. Let T be the true mean of the
ages in dogs, that is, the mean we’d compute if none of the
ages were missing.
What is the relationship between O and T?
O < T
O \approx T
O = T
O > T
Answer: O < T
In the ages we get to observe (that is, when age is not missing), we have way fewer terrier values than in the ages we don’t get to observe. Terriers are older on average than the other breed classes. This means we’re missing values that are larger, so when we take the average of the values we have access to, it’ll be lower than the true mean.
The average score on this problem was 35%.
Consider the following strategy for imputing missing ages.
def fill_missing(dogs):
  return dogs.assign(
    age=dogs.groupby("class")["age"]
            .transform(lambda x: x.fillna(x.value_counts().idxmax()))
)In one sentence, describe this imputation strategy.
Answer: This is filling in missing ages in each breed class with the most common observed age in that breed class
The average score on this problem was 77%.
small_dogs is a subset of dogs shown in its
entirety below.
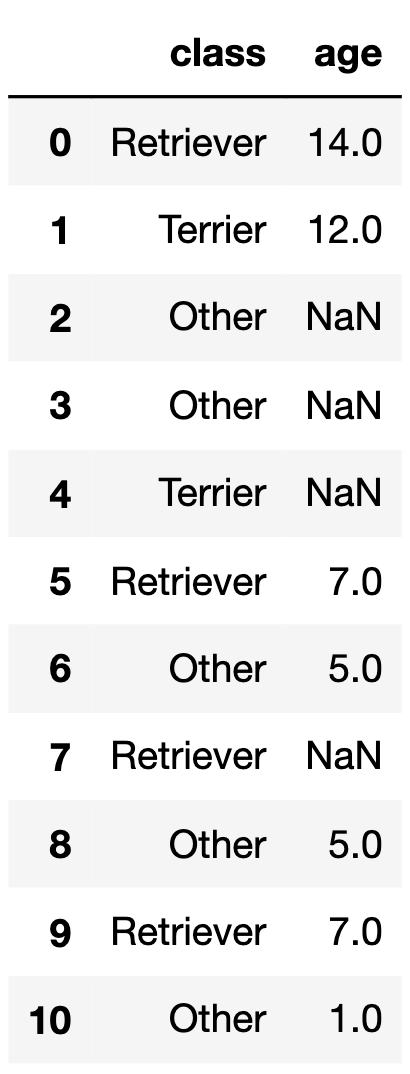
If we call fill_missing on small_dogs, what
values would the four null values in the "age" column of
small_dogs be replaced with?
Answer:
"Other"
breed class is 5."Other"
breed class is 5."Terrier" breed class is 12."Retriever" breed class is 7.
The average score on this problem was 90%.