← return to practice.dsc80.com
Instructor(s): Suraj Rampure
This exam was administered in-person. The exam was closed-notes, except students were allowed to bring a single two-sided notes sheet. No calculators were allowed. Students had 50 minutes to take this exam.
Welcome to the Midterm Exam for DSC 80 in Winter 2023!
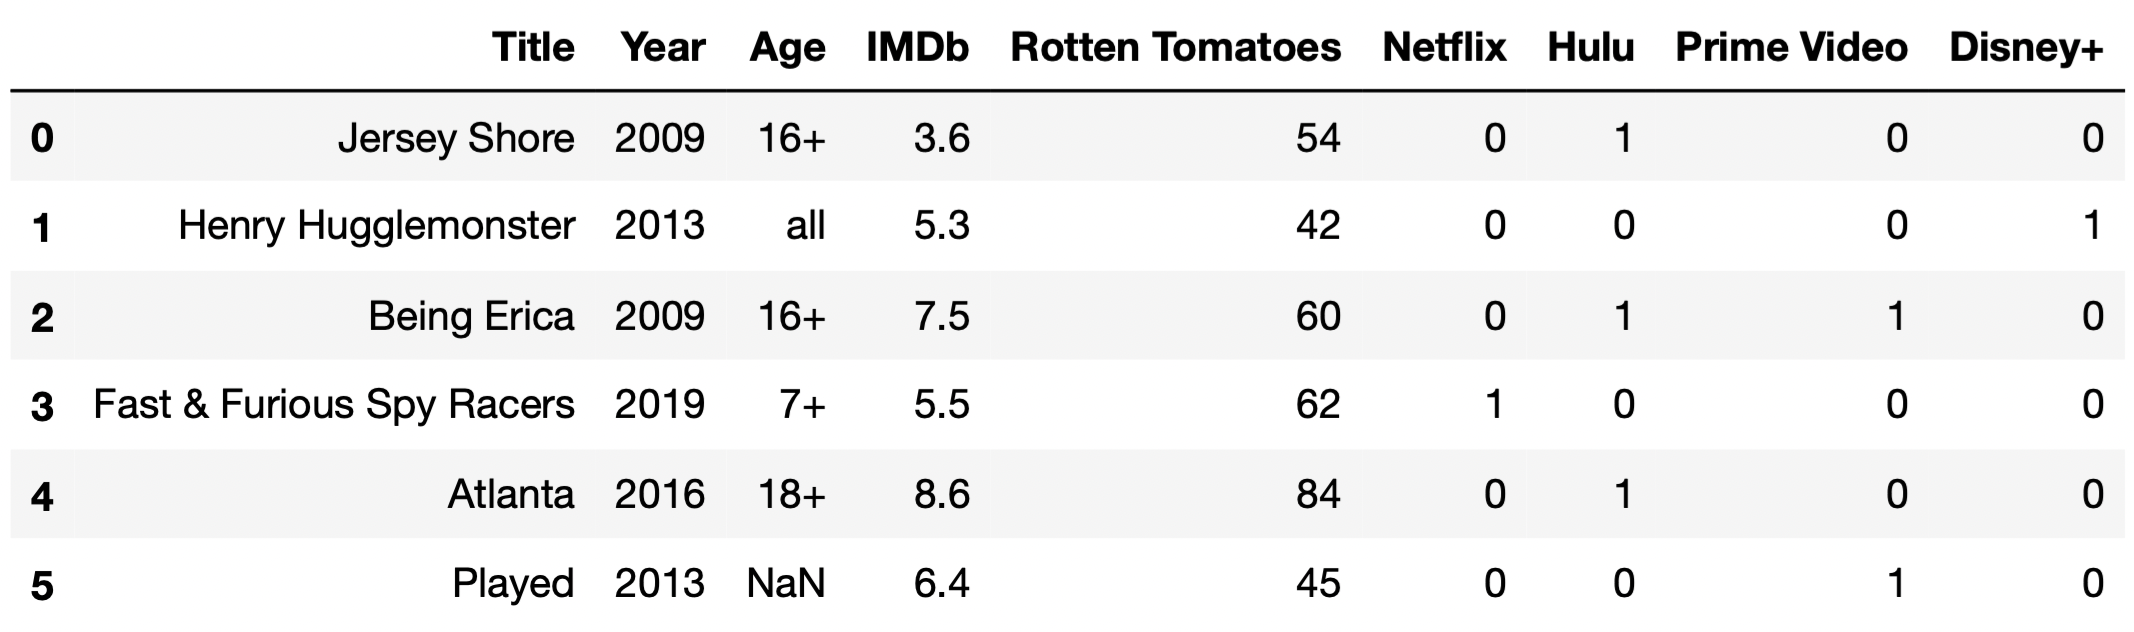
Throughout this exam, we will work with the DataFrame
tv, which contains information about various TV shows
available to watch on streaming services. For each TV show, we have:
"Title" (object): The title of the TV show."Year" (int): The year in which the TV show was first
released. (For instance, the show How I Met Your Mother ran
from 2005 to 2014; there is only one row for How I Met Your
Mother in tv, and its "Year" value is
2005.)"Age" (object): The age category for the TV show. If
not missing, "Age" is one of "all",
"7+", "13+", "16+", or
"18+". (For instance, "all" means that the
show is appropriate for all audiences, while `“18+”} means that the show
contains mature content and viewers should be at least 18 years
old.)"IMDb" (float): The TV show’s rating on IMDb (between 0
and 10)."Rotten Tomatoes" (int): The TV show’s rating on Rotten
Tomatoes (between 0 and 100)."Netflix" (int): 1 if the show is available for
streaming on Netflix and 0 otherwise. The "Hulu",
"Prime Video", and "Disney+" columns work the
same way.The first few rows of tv are shown below (though
tv has many more rows than are pictured here).
Assume that we have already run all of the necessary imports.
Throughout this exam, we will refer to tv
repeatedly.
What kind of variable is "Netflix"?
Quantitative discrete
Quantitative continuous
Qualitative ordinal
Qualitative nominal
Answer: Quantitative discrete
Remember, a variable is quantitative (i.e. numerical) if arithmetic
operations have meaning. If we add up the values in the
"Netflix" column for a subset of the rows, we get the
number of TV shows in that subset that are available for streaming on
Netflix. If we take the average of the values in the
"Netflix" column for a subset of the rows, we get the
proportion of TV shows in that subset that are available for streaming
on Netflix. Since arithmetic operations have meaning,
"Netflix" is quantitative, and since it can only take on a
finite number of values (just 0 or 1) it is also discrete.
The average score on this problem was 22%.
In the following subparts, consider the variable
double_count, defined below.
double_count = tv["Title"].value_counts().value_counts()What is type(double_count)?
Series
SeriesGroupBy
DataFrame
DataFrameGroupBy
Answer: Series
The .value_counts() method, when called on a Series
s, produces a new Series in which
s.s.Since tv["Title"] is a Series,
tv["Title"].value_counts() is a Series, and so is
tv["Title"].value_counts.value_counts(). We provide an
interpretation of each of these Series in the solution to the next
subpart.
The average score on this problem was 84%.
Which of the following statements are true? Select all that apply.
The only case in which it would make sense to set the index of
tv to "Title" is if
double_count.iloc[0] == 1 is True.
The only case in which it would make sense to set the index of
tv to "Title" is if
double_count.loc[1] == tv.shape[0] is
True.
If double_count.loc[2] == 5 is True, there
are 5 TV shows that all share the same "Title".
If double_count.loc[2] == 5 is True, there
are 5 pairs of 2 TV shows such that each pair shares the same
"Title".
None of the above.
Answers:
tv to "Title" is if
double_count.loc[1] == tv.shape[0] is
True.double_count.loc[2] == 5 is True, there
are 5 pairs of 2 TV shows such that each pair shares the same
"Title".To answer, we need to understand what each of
tv["Title"], tv["Title"].value_counts(), and
tv["Title"].value_counts().value_counts() contain. To
illustrate, let’s start with a basic, unrelated example. Suppose
tv["Title"] looks like:
0    A
1    B
2    C
3    B
4    D
5    E
6    A
dtype: object
Then, tv["Title"].value_counts() looks like:
A    2
B    2
C    1
D    1
E    1
dtype: int64
and tv["Title"].value_counts().value_counts() looks
like:
1    3
2    2
dtype: int64
Back to our actual dataset. tv["Title"], as we know,
contains the name of each TV show.
tv["Title"].value_counts() is a Series whose index is a
sequence of the unique TV show titles in tv["Title"], and
whose values are the frequencies of each title.
tv["Title"].value_counts() may look something like the
following:
Breaking Bad                             1
Fresh Meat                               1
Doctor Thorne                            1
                                       ...
Styling Hollywood                        1
Vai Anitta                               1
Fearless Adventures with Jack Randall    1
Name: Title, Length: 5368, dtype: int64
Then, tv["Title"].value_counts().value_counts() is a
Series whose index is a sequence of the unique values in the above
Series, and whose values are the frequencies of each value above. In the
case where all titles in tv["Title"] are unique, then
tv["Title"].value_counts() will only have one unique value,
1, repeated many times. Then,
tv["Title"].value_counts().value_counts() will only have
one row total, and will look something like:
1    5368
Name: Title, dtype: int64
This allows us to distinguish between the first two answer choices. The key is remembering that in order to set a column to the index, the column should only contain unique values, since the goal of the index is to provide a “name” (more formally, a label) for each row.
tv to "Title" is if
double_count.iloc[0] == 1 is True”, is false.
As we can see in the example above, all titles are unique, but
double_count.iloc[0] is something other than 1.tv to "Title" is if
double_count.loc[1] == tv.shape[0] is True”,
is true. If double_count.loc[1] == tv.shape[0], it means
that all values in tv["Title"].value_counts() were 1,
meaning that tv["Title"] consisted solely of unique values,
which is the only case in which it makes sense to set
"Title" to the index.Now, let’s look at the second two answer choices. If
double_counts.loc[2] == 5, it would mean that 5 of the
values in tv["Title"].value_counts() were 2. This would
mean that there were 5 pairs of titles in tv["Title"] that
were the same.
double_count.loc[2] == 5 is True, there are 5
pairs of 2 TV shows such that each pair shares the same
"Title"”, correct.double_count.loc[2] == 5
is True, there are 5 TV shows that all share the same
"Title"”, is incorrect; if there were 5 TV shows with the
same title, then double_count.loc[5] would be at least 1,
but we can’t make any guarantees about
double_counts.loc[2].
The average score on this problem was 68%.
Ethan is an avid Star Wars fan, and the only streaming service he has an account on is Disney+. (He had a Netflix account, but then Netflix cracked down on password sharing.)
Fill in the blanks below so that star_disney_prop
evaluates to the proportion of TV shows in tv with
"Star Wars" in the title that are available to stream on
Disney+.
star_only = __(a)__
star_disney_prop = __(b)__ / star_only.shape[0]
What goes in the blanks?
Answers:
tv[tv["Title"].str.contains("Star Wars")]star_only["Disney+"].sum()We’re asked to find the proportion of TV shows with
"Star Wars" in the title that are available to stream on
Disney+. This is a fraction, where:
"Star Wars" in the title and are available
to stream on Disney+."Star Wars" in the title.The key is recognizing that star_only must be a
DataFrame that contains all the rows in which the "Title"
contains "Star Wars"; to create this DataFrame in blank
(a), we use tv[tv["Title"].str.contains("Star Wars")].
Then, the denominator is already provided for us, and all we need to
fill in is the numerator. There are a few possibilities, though they all
include star_only:
star_only["Disney+"].sum()(star_only["Disney+"] == 1).sum()star_only[star_only["Disney+"] == 1].shape[0]Common misconception: Many students calculated the
wrong proportion: they calculated the proportion of shows available to
stream on Disney+ that have "Star Wars" in the title. We
asked for the proportion of shows with "Star Wars" in the
title that are available to stream on Disney+; “proportion of X that Y” is
always \frac{\# X \text{ and } Y}{\#
X}.
The average score on this problem was 84%.
As you saw in the first few rows of tv, some TV shows
are available for streaming on multiple streaming services. Fill in the
blanks so that the two expressions below, Expression 1 and Expression 2,
both evaluate to the "Title" of the TV
show that is available for streaming on the greatest number of
streaming services. Assume there are no ties and that the
"Title" column contains unique values.
Expression 1:
tv.set_index("Title").loc[__(a)__].T.sum(axis=0).idxmax()Expression 2:
    (
        tv.assign(num_services=tv.iloc[__(b)__].sum(__(c)__))
            .sort_values("num_services")
            .iloc[__(d)__]
)Hint: .T transposes the rows
and columns of a DataFrame — the indexes of df are the
columns of df.T and vice versa.
What goes in the blanks?
Answers:
:, "Netflix": or some variation of that:, 5: or some variation of thataxis=1-1, 0In Expression 1, keep in mind that idxmax() is a Series
method returns the index of the row with the maximum value. As such, we
can infer that Expression 1 sums the service-specific indicator columns
(that is, the columns "Netflix", "Hulu",
"Prime Video", and "Disney+") for each row and
returns the index of the row with the greatest sum. To do this, we need
the loc accessor to select all the service-specific
indicator columns, which we can do using loc[:, "Netflix":]
or
loc[:, ["Netflix", "Hulu", "Prime Video", "Disney+"]].
When looking at Expression 2, we can split the problem into two
parts: the code inside the assign statement and the code
outside of it.
assign statement,
(and also noticing the variable num_services), we realize
that we, once again, want to sum up the values in the service-specific
indicator columns. We do this by first selecting the last four columns,
using .iloc[:, 5:] (notice the iloc), and then
summing over axis=1. We use axis=1 (different
from axis=0 in Expression 1), because unlike Expression 1,
we’re summing over each row, instead of each column. If there had not
been a .T in the code for Expression 1, we would’ve also
used axis=1 in Expression 1."Title" of the last row
in DataFrame in Expression 2, because sort_values sorts in
ascending order by default. The last row has an integer position of -1,
and the "Title" column has an integer position of 0, so we
use iloc[-1, 0].
The average score on this problem was 69%.
In 2020, during the early COVID era, popular shows like Never Have I Ever, The Last Dance, and The Queen’s Gambit were all released. What they all share in common, other than high viewership numbers and popularity on social media, are high ratings on both IMDb and Rotten Tomatoes.
Fill in the blank below so that top_years evaluates to
an array of the years in which
at least 5 TV shows with an IMDb rating of 9 or higher were
released.
top_years = tv.groupby("Year").filter(____)["Year"].unique()What goes in the blank?
Answer:
lambda df: (df["IMDb"] >= 9).sum() >= 5
The filter method of a DataFrameGroupBy
object takes in a function. That function should itself take in a
DataFrame, corresponding to all of the rows for a particular
"Year", and return either True or
False. The result,
tv.groupby("Year").filter(<our function>), will be a
DataFrame containing only the rows in which the returned Boolean by our
function is True. For instance,
tv.groupby("Year").filter(lambda df: df.shape[0] >= 2)
will contain all of the rows for "Years" with at least 2 TV
shows.
In our case, we want
tv.groupby("Year").filter(<our function>) to evaluate
to a DataFrame with all of the "Years" that have at least 5
TV shows that have an "IMDb" rating of at least 9 (since
the provided code afterwards, ["Year"].unique(), finds all
of the unique "Year"s in the DataFrame we produce). If
df is a DataFrame of TV shows, then
(df["IMDb"] >= 9).sum() is the number of TV shows in
that DataFrame with an "IMDb" rating of at least 9, and
(df["IMDb"] >= 9).sum() >= 5 is True
only for DataFrames in which there are at least 5 TV shows with an
"IMDb" rating of at least 9. Thus, the answer we were
looking for is
lambda df: (df["IMDb"] >= 9).sum() >= 5.
Another good answer we saw was
lambda df: df.loc[df["IMDb"] >= 9, "Title"].nunique() >= 5.
Fun fact: In the DataFrame we used to produce the exam, the only year that satisfied the above criteria was 2020!
The average score on this problem was 56%.
For your convenience, the first few rows of tv are shown
again below.
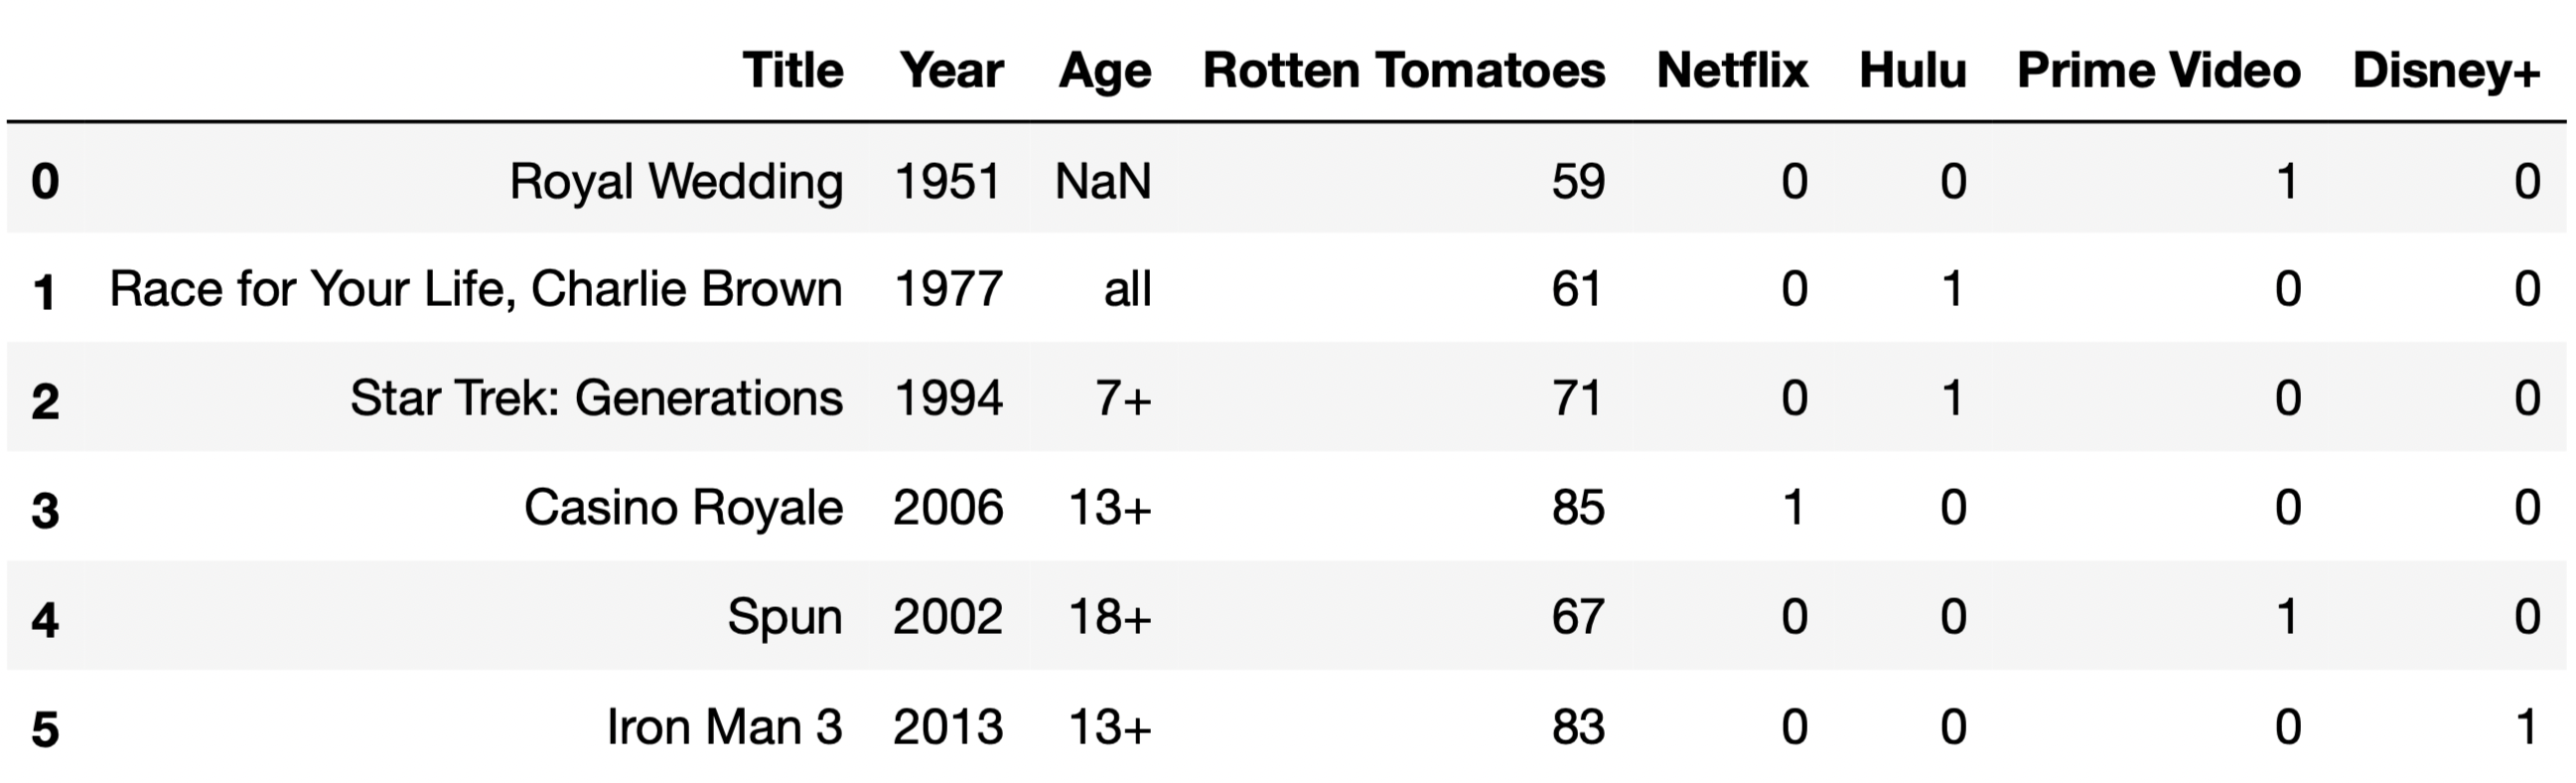
For the purposes of this question only, suppose we have also access
to another similar DataFrame, movies, which contains
information about a variety of movies. The information we have for each
movie in movies is the same as the information we have for
each TV show in tv, except for IMDb ratings, which are
missing from movies.
The first few rows of movies are shown below (though
movies has many more rows than are pictured here).
The function total_null, defined below, takes in a
DataFrame and returns the total number of null values in the
DataFrame.
total_null = lambda df: df.isna().sum().sum()Consider the function delta, defined below.
def delta(a, b):
    tv_a = tv.head(a)
    movies_b = movies.head(b)
    together = pd.concat([tv_a, movies_b])
    return total_null(together) - total_null(tv_a) - total_null(movies_b)
Which of the following functions is equivalent to
delta?
lambda a, b: a
lambda a, b: b
lambda a, b: 9 * a
lambda a, b: 8 * b
lambda a, b: min(9 * a, 8 * b)
Answer: lambda a, b: b
Let’s understand what each function does.
total_null just counts all the null values in a
DataFrame.delta concatenates the first a rows of
tv with the first b rows of
movies vertically, that is, on top of one
another (over axis 0). It then returns the difference between the total
number of null values in the concatenated DataFrame and the total number
of null values in the first a rows of tv and
first b rows of movies – in other words, it
returns the number of null values that were added as a result of
the concatenation.The key here is recognizing that tv and
movies have all of the same column names,
except movies doesn’t have an
"IMDb" column. As a result, when we concatenate, the
"IMDb" column will contain null values for every row that
was originally from movies. Since b rows from
movies are in the concatenated DataFrame, b
new null values are introduced as a result of the concatenation, and
thus lambda, a, b: b does the same thing as
delta.
The average score on this problem was 58%.
Fill in the blank to complete the implementation of the function
size_of_merge, which takes a string col,
corresponding to the name of a single column that is
shared between tv and movies, and returns the
number of rows in the DataFrame
tv.merge(movies, on=col).
For instance, size_of_merge("Year") should return
the number of rows in tv.merge(movies, on="Year").
The purpose of this question is to have you think conceptually
about how merges work. As such, solutions containing
merge or concat will receive 0
points.
What goes in the blank below?
def size_of_merge(col):
return (____).sum()Hint: Consider the behavior below.
>>> s1 = pd.Series({'a': 2, 'b': 3})
>>> s2 = pd.Series({'c': 4, 'a': -1, 'b': 4})
>>> s1 * s2
a    -2.0
b    12.0
c     NaN
dtype: float64Answer:
tv[col].value_counts() * movies[col].value_counts()
tv.merge(movies, on=col) contains one row for every
“match” between tv[col] and movies[col].
Suppose, for example, that col="Year". If
tv["Year"] contains 30 values equal to 2019, and
movies["Year"] contains 5 values equal to 2019,
tv.merge(movies, on="Year") will contain 30 \cdot 5 = 150 rows in which the
"Year" value is equal to 2019 – one for every combination
of a 2019 row in tv and a 2019 row in
movies.
tv["Year"].value_counts() and
movies["Year"].value_counts() contain, respectively, the
frequencies of the unique values in tv["Year"] and
movies["Year"]. Using the 2019 example from above,
tv["Year"].value_counts() * movies["Year"].value_counts()
will contain a row whose index is 2019 and whose value is 150, with
similar other entries for the other years in the two Series. (The hint
is meant to demonstrate the fact that no matter how the two Series are
sorted, the product is done element-wise by matching up indexes.) Then,
(tv["Year"].value_counts() * movies["Year"].value_counts()).sum()
will sum these products across all years, ignoring null values.
As such, the answer we were looking for is
tv[col].value_counts() * movies[col].value_counts()
(remember, "Year" was just an example for this
explanation).
The average score on this problem was 14%.
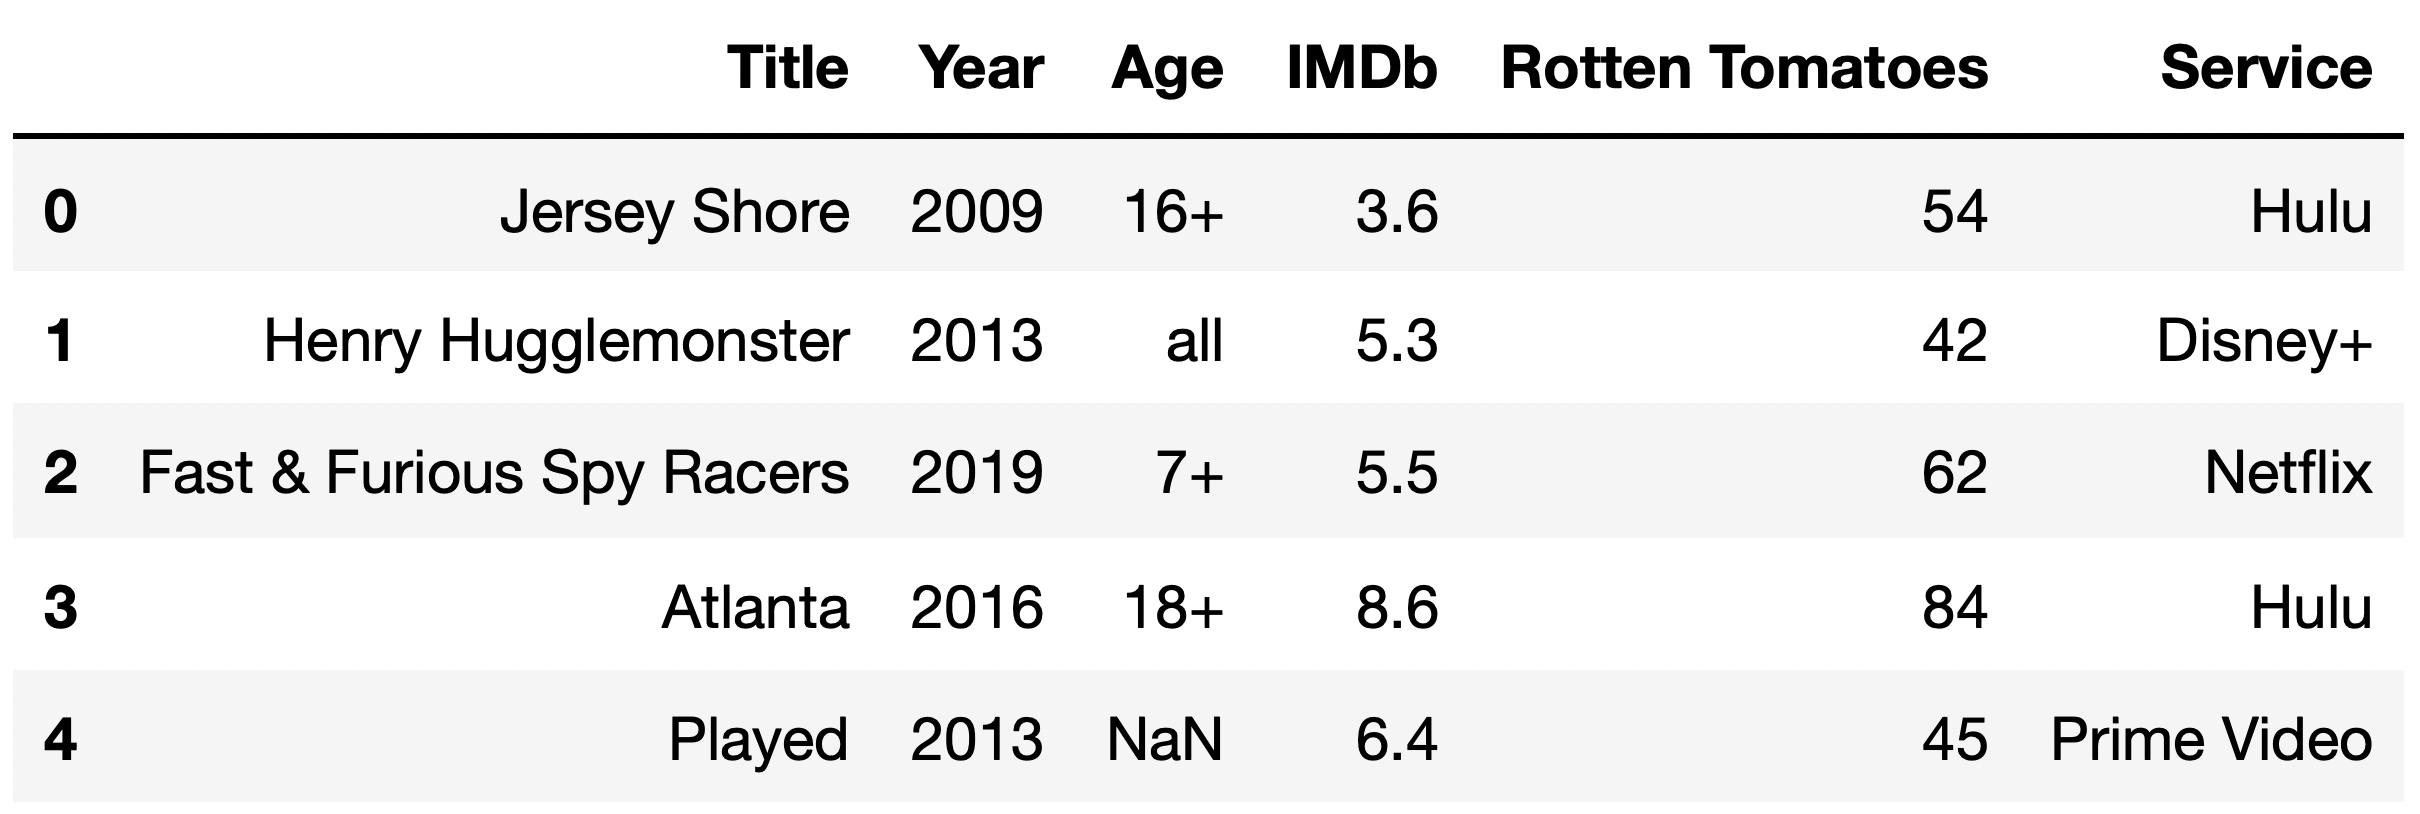
For the remainder of the exam, we will only consider TV shows that
are available to stream exclusively on a single streaming
service. The DataFrame tv_excl contains all of the
information we have for these TV shows. Note that instead of containing
separate columns for each streaming service, as tv did,
tv_excl instead has a single "Service" column
that contains the name of the one streaming service that the TV show is
available for streaming on.
The first few rows of tv_excl are shown below (though,
of course, tv_excl has many more rows than are pictured
here). Note that Being Erica is not in tv_excl,
since it is available to stream on multiple services.
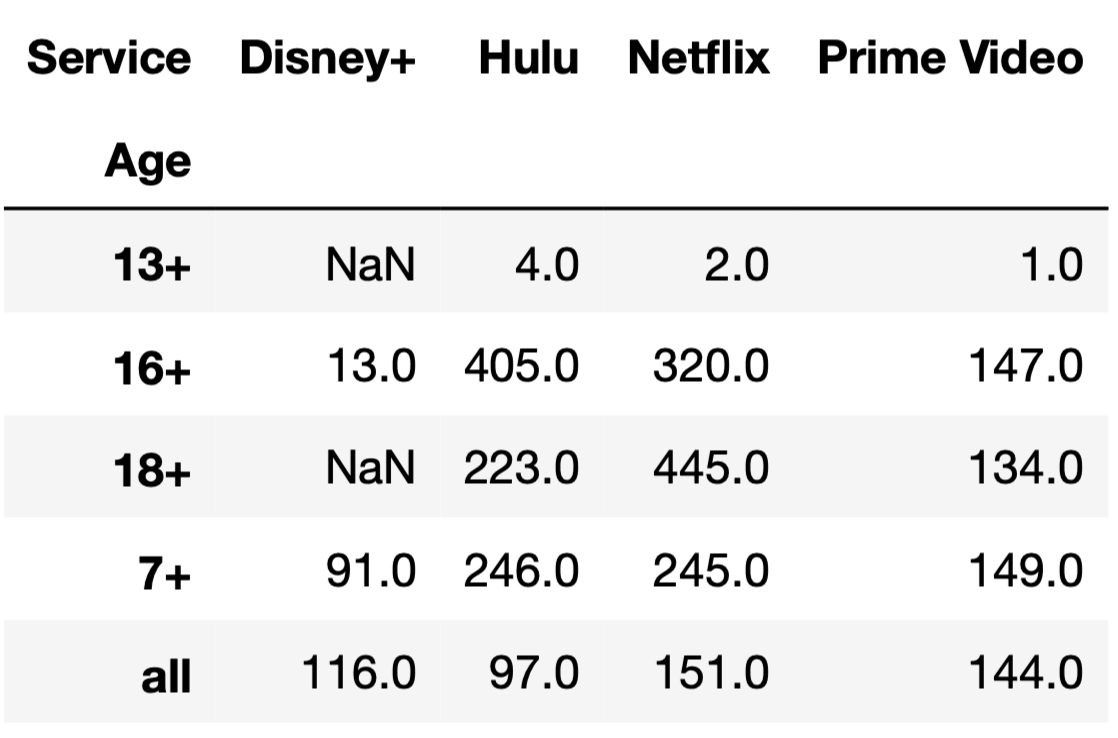
The DataFrame counts, shown in full below, contains the
number of TV shows for every combination of "Age" and
"Service".
Given the above information, what does the following expression evaluate to?
tv_excl.groupby(["Age", "Service"]).sum().shape[0]4
5
12
16
18
20
25
Answer: 18
Note that the DataFrame counts is a pivot table, created
using
tv_excl.pivot_table(index="Age", columns="Service", aggfunc="size").
As we saw in lecture, pivot tables contain the same information as the
result of grouping on two columns.
The DataFrame tv_excl.groupby(["Age", "Service"]).sum()
will have one row for every unique combination of "Age" and
"Service" in tv_excl. (The same is true even
if we used a different aggregation method, like .mean() or
.max().) As counts shows us,
tv_excl contains every possible combination of a single
element in {"13+", "16+", "18+",
"7+", "all"} with a single element in
{"Disney+", "Hulu", "Netflix",
"Prime Video"}, except for ("13+",
"Disney+") and ("18+",
"Disney+"), which were not present in tv_excl;
if they were, they would have non-null values in
counts.
As such, tv_excl.groupby(["Age", "Service"]).sum() will
have 20 - 2 = 18 rows, and
tv_excl.groupby(["Age", "Service"]).sum().shape[0]
evaluates to 18.
The average score on this problem was 34%.
Tiffany would like to compare the distribution of "Age"
for Hulu and Netflix. Specifically, she’d like to test the following
hypotheses:
Null Hypothesis: The distributions of
"Age" for Hulu and Netflix are drawn from the same
population distribution, and any observed differences are due to random
chance.
Alternative Hypothesis: The distributions of
"Age" for Hulu and Netflix are drawn from different
population distributions.
What type of test is this?
Hypothesis test
Permutation test
Answer: Permutation test
A permutation test is a statistical test in which we aim to determine
if two samples look like they were drawn from the same unknown
population. Here, our two samples are the distribution of
"Age"s for Hulu and the distribution of "Age"s
for Netflix.
The average score on this problem was 97%.
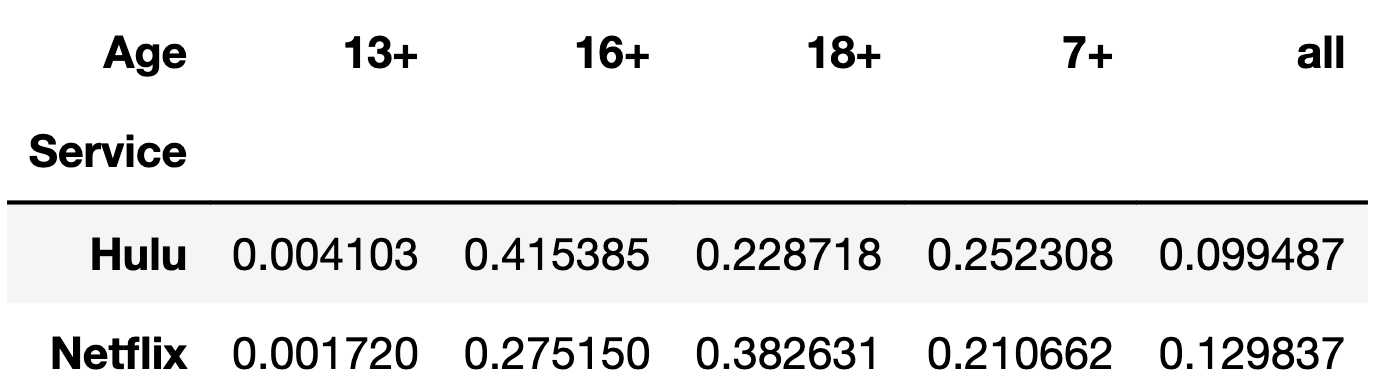
Consider the DataFrame distr, defined below.
hn = counts[["Hulu", "Netflix"]]
distr = (hn / hn.sum()).T  # Note that distr has 2 rows and 5 columns.
To test the hypotheses in part (b), Tiffany decides to use the total variation distance as her test statistic. Which of the following expressions DO NOT correctly compute the observed statistic for her test? Select all that apply.
distr.diff().iloc[-1].abs().sum() / 2
distr.diff().sum().abs().sum() / 2
distr.diff().sum().sum().abs() / 2
(distr.sum() - 2 * distr.iloc[0]).abs().sum() / 2
distr.diff().abs().sum(axis=1).iloc[-1] / 2
None of the above: all above options correctly compute the observed statistic.
Answer:
distr.diff().sum().sum().abs() / 2 only
First, note that the difference between the TVD calculation here and
those in lecture is that our pivot table contains one
row for each distribution, rather than one
column for each distribution. This is because of the
.T in the code snippet above. distr may look
something like:
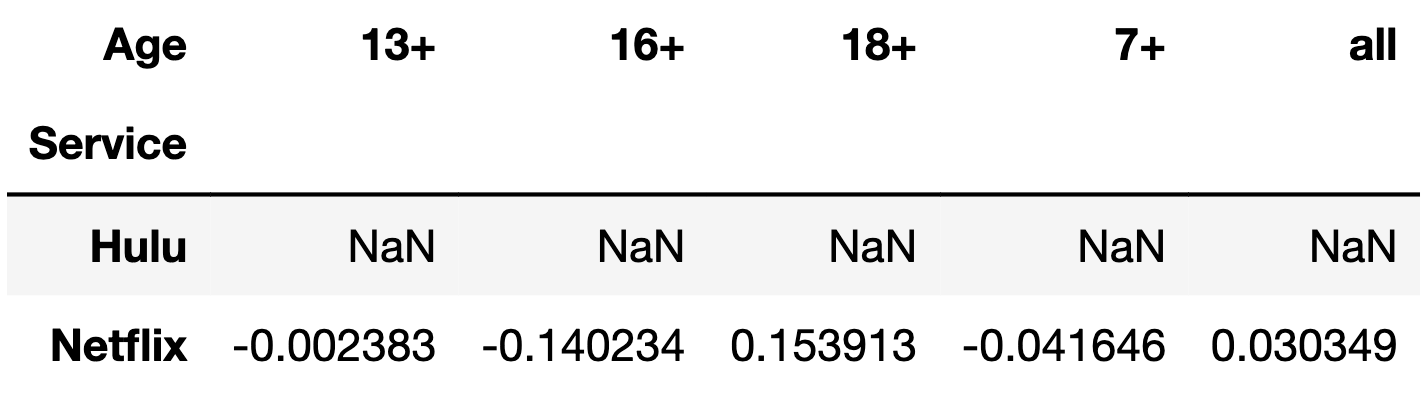
As such, here we need to apply the .diff() method to
each column first, not each row (meaning we should supply
axis=0 to diff, not axis=1;
axis=0 is the default, so we don’t need to explicitly
specify it). distr.diff() may look something like:
With that in mind, let’s look at each option, remembering that the TVD is the sum of the absolute differences in proportions, divided by 2.
distr.diff().iloc[-1].abs().sum() / 2:
distr.diff().iloc[-1] contains the differences in
proportions.distr.diff().iloc[-1].abs() contains the absolute
differences in proportions.distr.diff().iloc[-1].abs().sum() / 2 contains the sum
of the absolute differences in proportions, divided by 2. This
is the TVD.distr.diff().sum().abs().sum() / 2:
distr.diff().sum() is a Series containing just the last
row in distr.diff(); remember, null values are ignored when
using methods such as .mean() and .sum().distr.diff().sum().abs() contains the absolute
differences in proportions, and hence
distr.diff().sum().abs().sum() / 2 contains the sum of the
absolute differences in proportions, divided by 2. This is the
TVD.distr.diff().sum().sum().abs() / 2:
distr.diff().sum() contains the differences in
proportions (explained above).distr.diff().sum().sum() contains the sum of the
differences in proportions. This is 0; remember, the
reason we use the absolute value is to prevent the positive and negative
differences in proportions from cancelling each other out. As a result,
this option does not compute the TVD; in fact, it
errors, because distr.diff().sum().sum() is a single
float, and floats don’t have an
.abs() method.(distr.sum() - 2 * distr.iloc[0]).abs().sum() / 2:
distr.sum() is the same as
distr.iloc[0] + distr.iloc[1], so
distr.sum() - 2 * distr.iloc[0] is
distr.iloc[0] + distr.iloc[1] - 2 * distr.iloc[0] which is
distr.iloc[1] - distr.iloc[0], which is just
distr.diff().iloc[-1].distr.diff().iloc[-1].abs().sum() / 2, which is the same as
Option 1. This is the TVD.distr.diff().abs().sum(axis=1).iloc[-1] / 2:
distr.diff().abs() is a DataFrame in which the last row
contains the absolute differences in proportions.distr.diff().abs().sum(axis=1) is a Series in which the
first element is null and the second element is the sum of the absolute
differences in proportions.distr.diff().abs().sum(axis=1).iloc[-1] / 2 is
the sum of the absolute differences in proportions divided by 2.
This is the TVD.
The average score on this problem was 67%.
Doris proposes a novel approach for testing the hypotheses in part
(b). She proposes we compute the distribution of "Age" for
all TV shows in tv_excl, ignoring the streaming service
they’re available on. Then, she suggests we run two separate tests of
the following hypotheses, using the same significance level as used for
the tests in part (b):
Null Hypothesis: The distribution of
"Age" for service X is
drawn from the distribution of "Age" for all services we
have data for.
Alternative Hypothesis: The distribution of
"Age" for service X is not
drawn from the distribution of "Age" for all services we
have data for.
She suggests we test the above pair of hypotheses separately for Hulu and Netflix, and gives the following interpretations:
If we fail to reject both null hypotheses here, we can also fail to reject the null hypothesis in part (b).
If we reject both null hypotheses here, we can also reject the null hypothesis in part (b).
What type of test is Doris proposing we run?
Hypothesis test
Permutation test
Answer: Hypothesis test
A hypothesis test is a statistical test in which we aim to determine
whether a sample looks like it was drawn at random from a known
population. Here, Doris is proposing we run two separate hypothesis
tests: one in which we determine whether the distribution of
"Age" for Hulu (sample) is drawn from the distribution of
"Age" in our entire dataset (population), and one in which
we determine whether the distribution of "Age" for Netflix
(sample) is drawn from the distribution of "Age" in our
entire dataset (population).
The average score on this problem was 93%.
Which of Doris’ interpretations are valid? Select all that apply.
Interpretation 1: If we fail to reject both null hypotheses here, we can also fail to reject the null hypothesis in Problem 6.2.
Interpretation 2: If we reject both null hypotheses here, we can also reject the null hypothesis in Problem 6.2.
Neither interpretation is valid.
Answer: Interpretation 1 only
Let’s consider each option.
"Age" for Hulu looks like a random sample from the
distribution of "Age" in our full dataset, and so does the
distribution of "Age" for Netflix. (Note that we can’t
conclude they are random samples from the distribution of
"Age" in our full dataset, since we can’t prove the null,
we can only fail to reject it). If that’s the case, the distributions of
"Age" for Hulu and Netflix both look like they’re drawn
from the same population, which means we fail to reject the null from
Problem 6.2."Age" for Hulu nor the distribution of "Age"
for Netflix look like a random sample of "Age" in our full
dataset. However, that doesn’t imply that these two distributions don’t
look like samples of the same population; all it implies is that they
don’t look like samples of this particular population. It is still
possible that there exists some population distribution that the
distributions of "Age" for Hulu and Netflix both look like
they’re drawn from, which means we can’t automatically reject the null
from Problem 6.2.
The average score on this problem was 60%.
The "IMDb" column in tv_excl contains
several missing values.
Note: Answer each subpart of this question independently of other subparts.
Given no other information other than a TV show’s
"Title" and "IMDb" rating, what is the most
likely missingness mechanism of the "IMDb" column?
Missing by design
Not missing at random
Missing at random
Missing completely at random
Answer:
The answer we were looking for is not missing at random (NMAR). As we
saw repeatedly in lectures and Lab 5, in cases where all we have access
to is a single column with missing values, potentially with other
unrelated columns (like "Title" here), the best explanation
is that there is some inherent reason as to why the values in the column
with missing values are missing. Here, a reasonable interpretation is
that the "IMDb" scores that are missing are likely to come
from worse TV shows, and so lower scores are more likely to be missing.
Think about it like this – if a TV show is really great, presumably more
people would know about it, and it would be rated. If a TV show wasn’t
as good and wasn’t as popular, it is more likely to be ignored.
However, partial credit was awarded to those who answered missing completely at random.
The average score on this problem was 63%.
Now, suppose we discover that the median
"Rotten Tomatoes" rating among TV shows with a missing
"IMDb" rating is a 13, while the median
"Rotten Tomatoes" rating among TV shows with a present
"IMDb" rating is a 52.
Given this information, what is the most likely missingness mechanism
of the "IMDb" column?
Missing by design
Not missing at random
Missing at random
Missing completely at random
Answer: Missing at random
The problem tells us that the distribution of
"Rotten Tomatoes" when "IMDb" is missing (mean
13) is very different from the distribution of
"Rotten Tomatoes" when "IMDb" is not missing
(mean 52). As such, the missingness of "IMDb" appears to
depend on "Rotten Tomatoes", and so the most likely
missingness mechanism is missing at random.
The average score on this problem was 83%.
Suppose we want to perform a statistical test to determine whether
the missingness of "IMDb" depends on "Age".
Which of the following test statistics could we use? Select all that
apply.
Difference in means
Absolute difference in means
Total variation distance
The Kolmogorov-Smirnov statistic
None of the above
Answer: Total variation distance only
Our permutation test here needs to compare two distributions:
"Age" when "IMDb" is
missing."Age" when "IMDb" is
not missing.Since "Age" is a categorical variable – remember, its
only possible values are "7+", "13+",
"16+", "18+", and "all" – the
above two distributions are categorical. The only test statistic of the
options provided that compares categorical distributions is the total
variation distance.
The average score on this problem was 63%.
To determine whether the missingness of "IMDb" depends
on "Year", we produce the following plot.
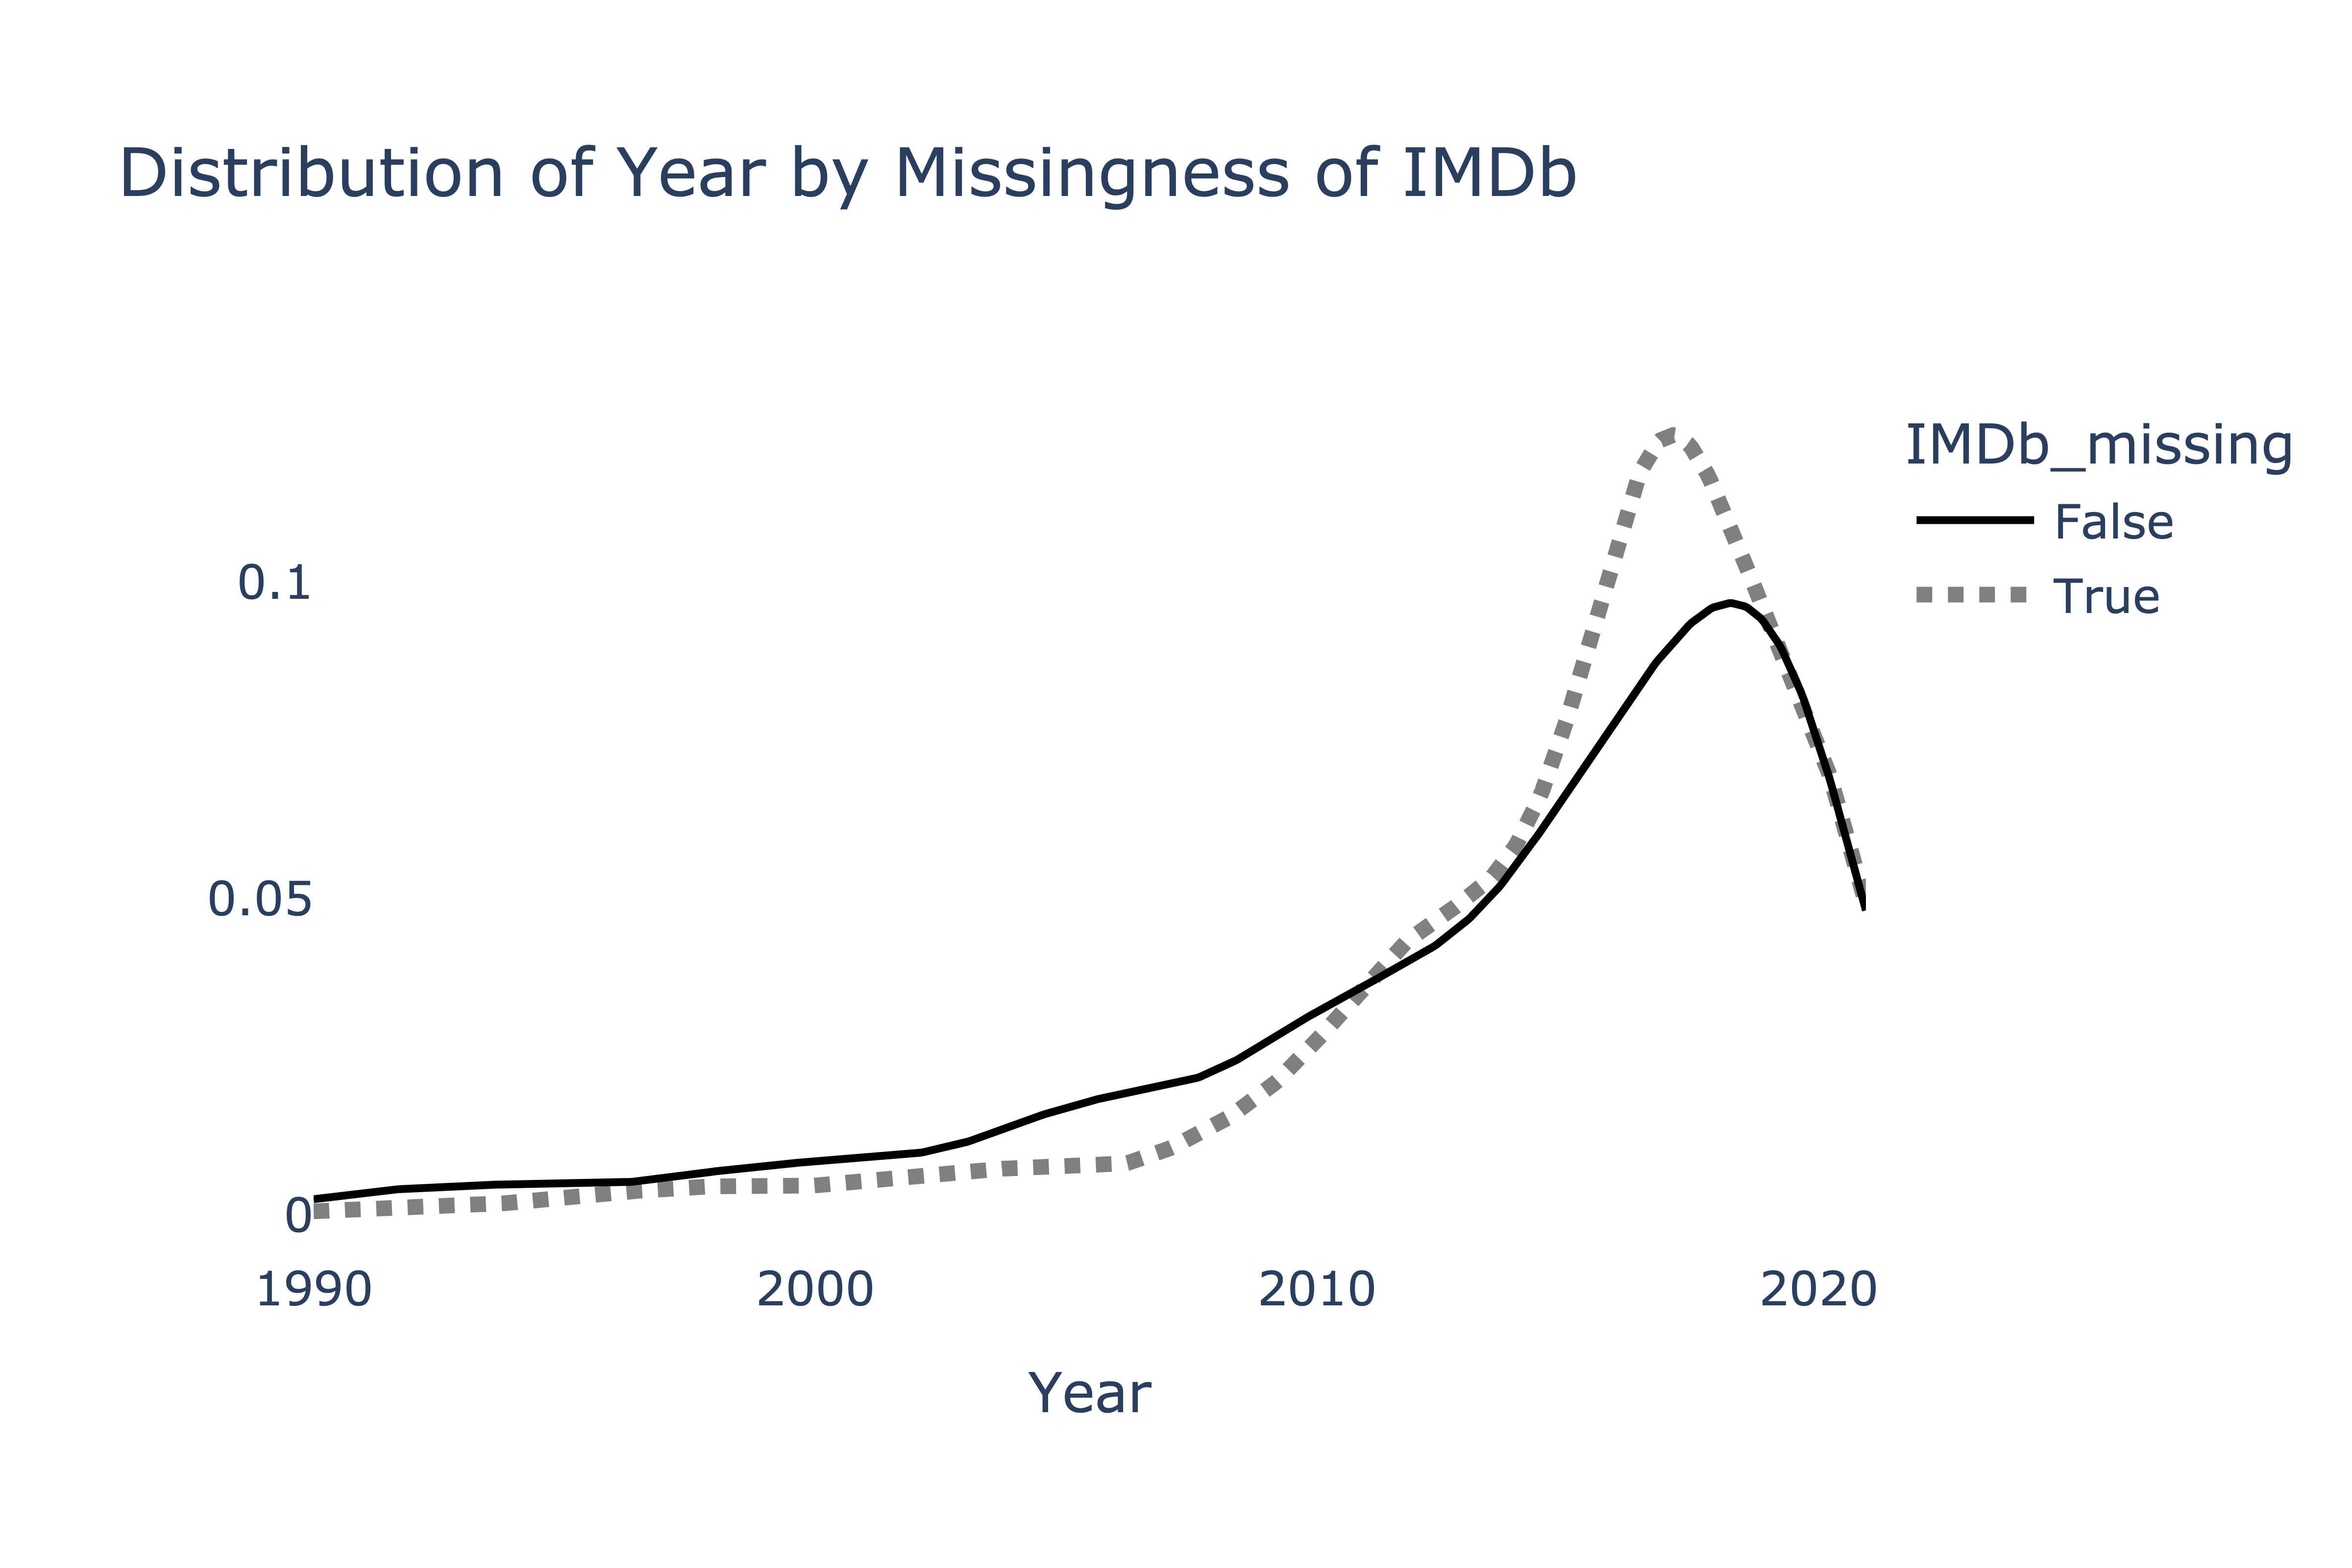
Suppose we want to perform a statistical test to determine whether the two distributions above come from the same population distribution. Which test statistic is most likely to yield a significant result?
Difference in means
Absolute difference in means
Total variation distance
The Kolmogorov-Smirnov statistic
Answer: The Kolmogorov-Smirnov statistic
First, note that the two distributions are quantitative, which means the TVD can’t be used here (the TVD only measures the difference between two categorical distributions).
To decide between the remaining options, note that the two distributions visualized appear to have the same mean, but different shapes. The Kolmogorov-Smirnov statistic is designed to detect differences in the shapes of distributions with the same center, and as such, it is the most likely to yield a significant result here. The others may not; since the means of the two distributions are very similar, the observed difference in means will be close to 0, which is a typical value under the null.
The average score on this problem was 89%.
To determine whether the missingness of "IMDb" depends
on "Service", we produce the following plot.
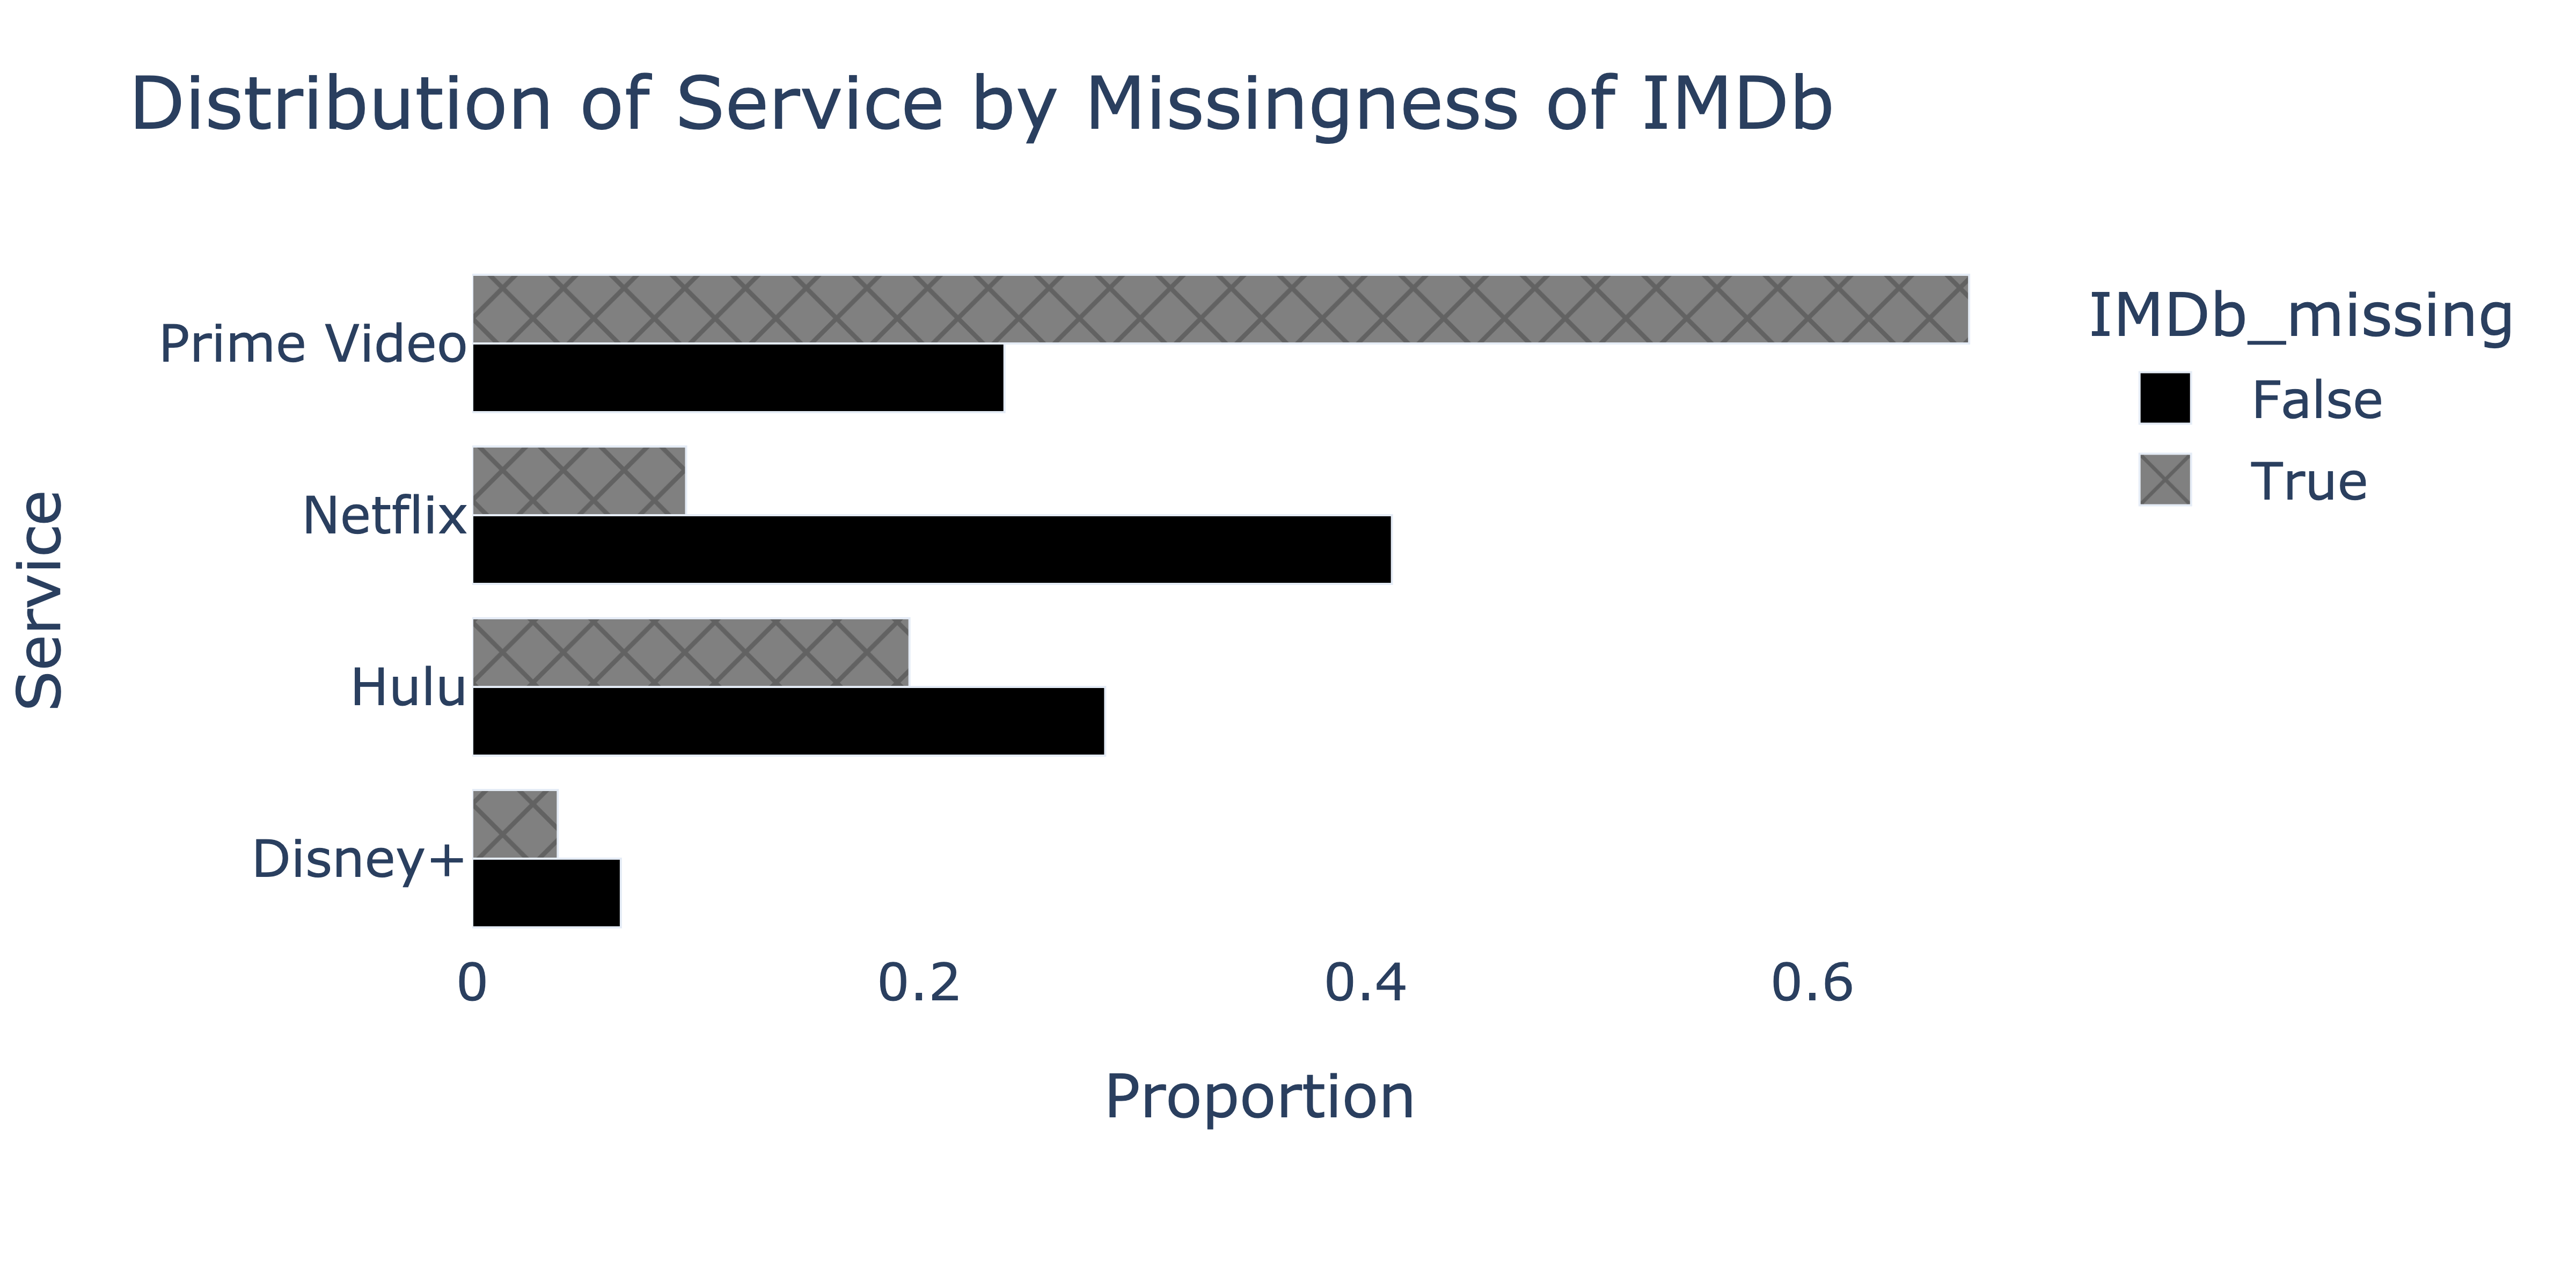
We’d like to fill in missing "IMDb" values in the
fastest, most efficient way possible, such that the mean of the imputed
"IMDb" column is as close to the true mean of the
"IMDb" column in nature as possible. Which imputation
technique should we use?
Unconditional mean imputation
Mean imputation, conditional on "Service"
Unconditional probabilistic imputation
Probabilistic imputation, conditional on "Service"
Since the missingness of "IMDb" appears to depend on
"Service", in order to accurately estimate the true mean of
the "IMDb" column, we must impute conditionally on
"Service", otherwise the imputed mean will be biased.
To decide between conditional mean imputation and conditional probabilistic imputation, note that we were asked to find the fasted, most efficient technique possible, such that the imputed mean is close to the true mean. Conditional mean imputation is more efficient than conditional probabilistic imputation, as probabilistic imputation requires sampling. While mean imputation shrinks the variance of the imputed distribution relative to the true distribution, we weren’t asked to preserve the variance of the true distribution, so conditional mean imputation is the right choice.
The average score on this problem was 46%.