← return to practice.dsc80.com
Instructor(s): Sam Lau
This exam was administered in-person. The exam was closed-notes, except students were allowed to bring a single two-sided notes sheet. No calculators were allowed. Students had 80 minutes to take this exam.
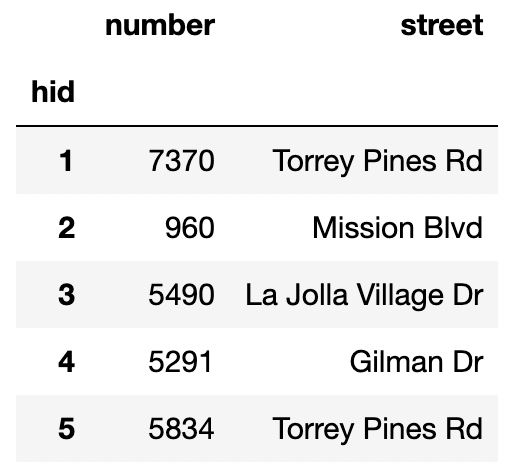
The h table records addresses within San Diego. Only 50
addresses are recorded. The index of the dataframe contains the numbers
1-50 as unique integers.
"number" (int): Street address number"street" (str): Street nameThe o table records information on power outages within
San Diego in April 2024. Only 100 outages are recorded. The index of the
dataframe contains the numbers 1-100 as unique integers.
"time" (pd.Timestamp): When the outage began"duration" (int): How long the outage lasted in
minutes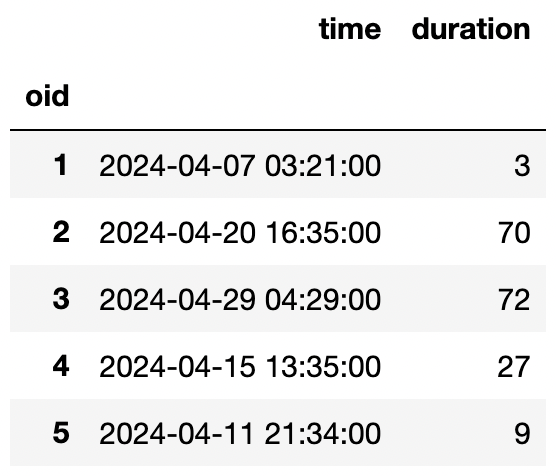
The j table is a table that links outages to addresses.
Each entry in the j table contains the hid of
the affected address and the oid of the outage. For
example, the first row of the table records that the outage with an
oid of 1 caused the power to go out at addresses with
hid 61 and 88. A single outage can affect multiple
addresses. There are no missing values and no duplicated rows in this
table, and all values are positive integers. This table records all the
addresses affected by all of the outages in 2024 so far.
"hid" (int): The hid of the affected
address"oid" (int): The oid of the outage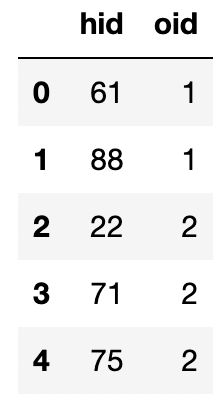
Fill in Python code below so that the last line of each part
evaluates to each desired result using the tables h,
o, and j as shown on the Reference Sheet.
Find the median duration of outages that happened in the early morning (before 8am).
o.loc[__(a)__,__(b)__].median()Answer:
(a): o['time'].dt.hour < 8
(b): 'duration'
A Series containing the mean outage duration for outages that happened on the weekend and outages that happened on weekdays.
Hint: If s is a Series of timestamps,
s.dt.dayofweek returns a Series of integers where 0 is
Monday and 6 is Sunday.
(o.assign(__(a)__)
.groupby(__(b)__)[__(c)__].mean())Answer:
(a): is\_weekend=o['time'].dt.dayofweek >= 5
(b): 'is\_weekend', (c): 'duration'
A DataFrame containing the proportion of 4-digit address numbers for
each unique street in h.
def foo(x):
    lengths = __(a)__
    return (lengths == 4).mean()

h.groupby(__(b)__).__(c)__(foo)Answer:
(a): x.astype(str).str.len()
(b): 'street'
(c): agg
What does the following code compute?
a = h.merge(j, left_index=True, right_on='hid', how='left')
a.loc[a['oid'].isna(), 'hid'].shape[0]
The number of addresses with exactly one outage.
The number of addresses with at least one outage.
The number of addresses with no outages.
The total number of addresses affected by all power outages.
The number of power outages.
The number of power outages that affected exactly one address.
The number of power outages that affected at least one address.
The number of power outages that affected no addresses.
0
The code will raise an error.
None of the above.
Answer: The number of addresses with no outages.
Consider the following code:
whoa = (h.merge(j, left_index=True, right_on='hid', how='left')
        .merge(o, left_on='oid', right_index=True, how='right')
        .reset_index(drop=True))
Consider the following variables:
a = j['hid'] <= 50
b = j['hid'] > 50
c = j['oid'] <= 100
d = j['oid'] > 100
e = (j[j['hid'] <= 50]
     .groupby('hid')
     .filter(lambda x: all(x['oid'] > 100))
     ['hid']
     .nunique())
f = (j[j['oid'] <= 100]
     .groupby('oid')
     .filter(lambda x: all(x['hid'] > 50))
     ['oid']
     .nunique())
g = len(set(h.index) - set(j['hid']))
i = len(set(o.index) - set(j['oid']))
Write a single expression that evaluates to the
number of rows in whoa. In your code, you may only use the
variables a, b, c,
d, e, f, g,
i as defined above, arithmetic and bitwise operators
(+, -, /, *,
&, |), and the np.sum()
function. You may not use any other variables or
functions. Your code might not need to use all of the variables
defined above.
Answer: np.sum(a & c) + f + i
We know that h has the numbers 1-50 as unique integers
in its index, and o has the numbers 1-100 as unique
integers in its index. However, the hid and
oid columns in j have values outside these
ranges. To approach this problem, it’s easiest to come up with smaller
versions of h, j, and o, then
perform the join by hand. For example, consider the following example
h, j, and o tables:
| hid |
|---|
| 1 |
| 2 |
| 3 |
| hid | oid |
|---|---|
| 1 | 1 |
| 2 | 1 |
| 2 | 10 |
| 2 | 11 |
| 10 | 3 |
| 11 | 3 |
| oid |
|---|
| 1 |
| 2 |
| 3 |
In this example, whoa would look like the following
(omitting other columns besides hid and oid
for brevity):
| hid | oid |
|---|---|
| 1 | 1 |
| 2 | 1 |
| NaN | 2 |
| NaN | 3 |
There are 3 cases where rows will be kept for whoa:
hid and oid match in the three
tables (when a and c are both true). In the
example above, this corresponds to the first two rows of
whoa.oid in o doesn’t appear at all in
j (calculated by i). In the example above,
this corresponds to the third row of whoa.oid in o does appear in
j, but none of the hid values appear in
h (calculated by f). In the example above,
this corresponds to the fourth row of whoa.Therefore, the number of rows in whoa is:
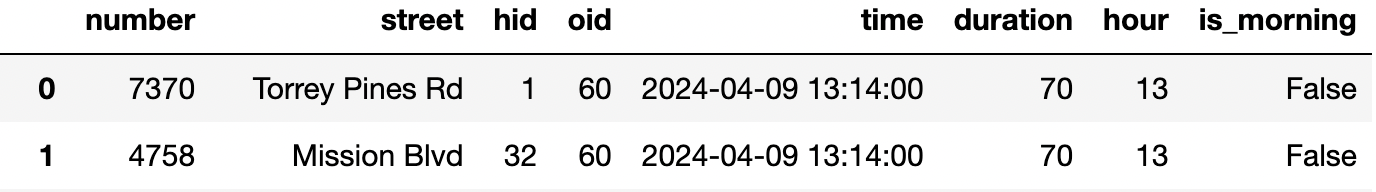
np.sum(a & c) + f + iConsider the following code which defines a DataFrame named
df:
def hour(df):       return df.assign(hour=df['time'].dt.hour)
def is_morning(df): return df.assign(is_morning=df['hour'] < 12)

df = (h.merge(j, left_index=True, right_on='hid', how='inner')
      .merge(o, left_on='oid', right_index=True, how='inner')
      .reset_index(drop=True)
      .pipe(hour)
      .pipe(is_morning))
The first few rows of df are shown below.
Suppose we define a DataFrame p and functions
a, b, c, and d as
follows:
p = df.pivot_table(index='street', columns='hour', values='duration',
                   aggfunc='count', fill_value=0)

def a(n):    return p[n].sum()
def b(s):    return p.loc[s].sum()
def c():     return p.sum().sum()
def d(s, n): return p.loc[s, n]
Write a single expression to compute each of the probabilities below.
Your code can only use the functions a,
b, c, d, and arithmetic operators
(+, -, /,
*).
The probability that a randomly selected row from df has
the street Mission Blvd.
Answer: b('Mission Blvd') / c()
The probability that a randomly selected row from df has
the street Gilman Dr given that its hour is
21.
Answer: d('Gilman Dr', 21) / a(21)
The probability that a randomly selected row from df
either has the street Mission Blvd or the hour
12.
Answer:
(b('Mission Blvd') + a(12) - d('Mission Blvd', 12)) / c()
Consider the following pivot table created using the df
table from Question~ which shows the average duration of power outages
split by street name and whether the outage happened before 12pm.
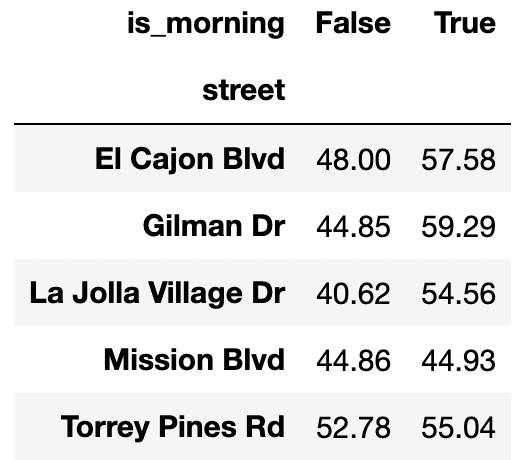
Given only the information in this pivot table and the Reference Sheet, is it possible to observe Simpson’s paradox for this data if we don’t split by street? In other words, is it possible that the average duration of power outages before 12pm is lower than the average duration of power outages after 12pm?
Yes
No
Need more information to determine
Answer: Yes
Notice that the overall average of the durations when
is_morning=True is a weighted average of the values in the
is_morning=True column of the pivot table. This means that
the overall average when is_morning=True must be between
(44.93, 59.29). Likewise, the overall average when
is_morning=False must be between (40.62, 52.78). This
implies that it’s possible for Simpson’s paradox to happen, since the
overall average when is_morning=False can be higher than
the average when is_morning=True.
Consider the following pivot table created using the o
table, which shows the average duration of power outages split by
whether the outage happened on the weekend and whether the outage
happened before 12pm.
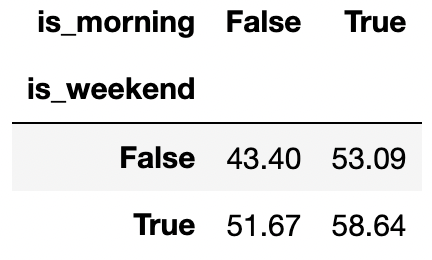
Given only the information in this pivot table and the Reference
Sheet, is it possible to observe Simpson’s paradox for this data if we
don’t split by is_weekend? In other words, is it possible
that the average duration of power outages before 12pm is lower than the
average duration of power outages after 12pm?
Yes
No
Need more information to determine
Answer: No
By the same logic as the previous part, the overall average when
is_morning=True must be between (53.09, 58.64). The overall
average when is_morning=False must be between (43.40,
51.67). This implies that Simpson’s paradox cannot happen, since the
overall average when is_morning=False will never be greater
than the overall average when is_morning=True.
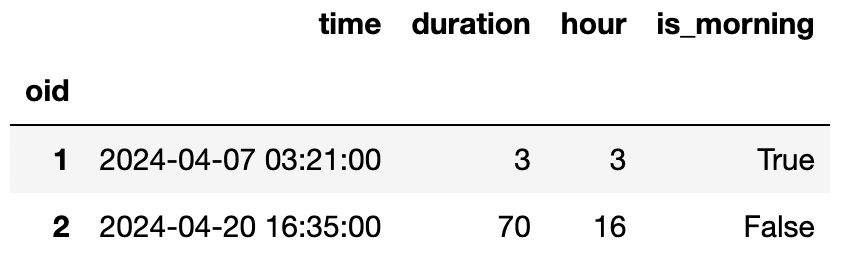
Praveen wants to answer the following questions using hypothesis
tests on the power outages data, so he adds a hour and
is_morning column to the o DataFrame. The
first few rows of the new o DataFrame are shown below. For
this problem, assume that some of the duration values are
missing.
For each test, select the one correct procedure to simulate a single sample under the null hypothesis, and select all test statistics that can be used for the hypothesis test among the choices given.
Null Hypothesis: Every hour of the day (0, 1, 2, etc.) has an equal probability of having a power outage.
Alternative Hypothesis: At least one hour is more prone to outages than others.
Simulation procedure:
np.random.multinomial(100, [1/2] * 2)
np.random.multinomial(100, [1/24] * 24)
o['hour'].sample(100)
np.random.permutation(o['duration'])
Test statistic:
Difference in means
Absolute difference in means
Total variation distance
K-S test statistic
Answer:
Simulation procedure:
np.random.multinomial(100, [1/24] * 24)
Test statistic: Total variation distance, K-S test statistic
Null: The proportion of outages that happen in the morning is the same for both recorded durations and missing durations.
Alternative: The outages are more likely to happen in the morning for missing durations than for recorded durations.
Simulation procedure:
np.random.multinomial(100, [1/2] * 2)
np.random.multinomial(100, [1/24] * 24)
o['hour'].sample(100)
np.random.permutation(o['duration'])
Test statistic:
Difference in means
Absolute difference in means
Total variation distance
K-S test statistic
Answer:
Simulation procedure:
np.random.permutation(o['duration'])
Test statistic: Difference in means
Null: The distribution of hours is the same for both recorded durations and missing durations.
Alternative: The distribution of hours is different for recorded durations and missing durations.
Simulation procedure:
np.random.multinomial(100, [1/2] * 2)
np.random.multinomial(100, [1/24] * 24)
o['hour'].sample(100)
np.random.permutation(o['duration'])
Test statistic:
Difference in means
Absolute difference in means
Total variation distance
K-S test statistic
Answer:
Simulation procedure:
np.random.permutation(o['duration'])
Test statistic: Absolute difference in means, Total variation distance, K-S test statistic
After loading in the DataFrame df from Question~, Sam
realizes that his puppy Bentley ate some of his data! The first few rows
of df are shown below for convenience.
Suppose that Sam sorted df by is_morning,
and then Bentley ate the first five values from the
duration column. What is the missingness mechanism for the
duration column?
Missing by design
MNAR
MAR on is_morning only
MAR on is_morning and hour only
MAR on is_morning, hour, and
time only
MCAR
Answer: MAR on is_morning,
hour, and time only
Sam believes that the data are MAR on hour only, so he
decides to use probabilistic imputation to fill in the missing values.
He uses the following code copied from Lecture 8 (line numbers shown in
parentheses):
(1)  def impute(s):
(2)      s = s.copy()
(3)      n = s.isna().sum()
(4)      fill = np.random.choice(s.dropna(), n)
(5)      s[s.isna()] = fill
(6)      return s
(7) df.groupby('hour')['duration'].transform(impute) The missing values in duration are actually NMAR.
The missing values in duration are actually MAR on
street, not hour.
There are no missing values in duration.
At least one hour value doesn’t have any missing
duration values.
At least one hour value only has missing
duration values.
There are no rows where hour == 12.
Line 1
Line 2
Line 3
Line 4
Line 5
Line 6
Line 7
Answer: 1. At least one hour value only
has missing duration values.
Answer: 2. Line 4