← return to practice.dsc80.com
Instructor(s): Sam Lau
This exam was administered in-person. The exam was closed-notes, except students were allowed to bring two two-sided cheat sheets. No calculators were allowed. Students had 180 minutes to take this exam.
The Open e-commerce dataset contains data about people’s Amazon.com
purchases. To collect the data, the researchers asked participants to
fill out a survey. Only participants who completed the survey were
recorded in the data. In one part of the survey, participants were given
instructions to download their Amazon purchase history and share it with
the researchers. Since this step was not required, not all participants
shared their Amazon purchase history with the researchers. The dataset
contains two tables, df and survey. The
df table was created from participants’ purchase history
and records individual items purchased from Amazon.
"date" (pd.Timestamp): The date that the purchase
was made.
"code" (float): Cost of one item in US
dollars.
"q" (float): Quantity of items purchased in the
order.
"state" (str): US state where the order was shipped.
If the item was an electronic gift card, the researchers recorded
NaN.
"name" (str): Name of the item.
"cat" (str): Category of the item.
"id" (str): Participant ID.
"id" (str): Participant ID. Some values in this
column don’t appear in the id column of
df.
"age" (str): Age of participant.
"income" (str): Income of participant.
"state" (str): US state where order was
shipped.
"marijuana" (str): Whether the participant reported
that they smoke marijuana (Yes) or don’t smoke marijuana (No).
"diabetes" (str): Whether the participant reported
that they have diabetes (Yes) or don’t have diabetes (No).
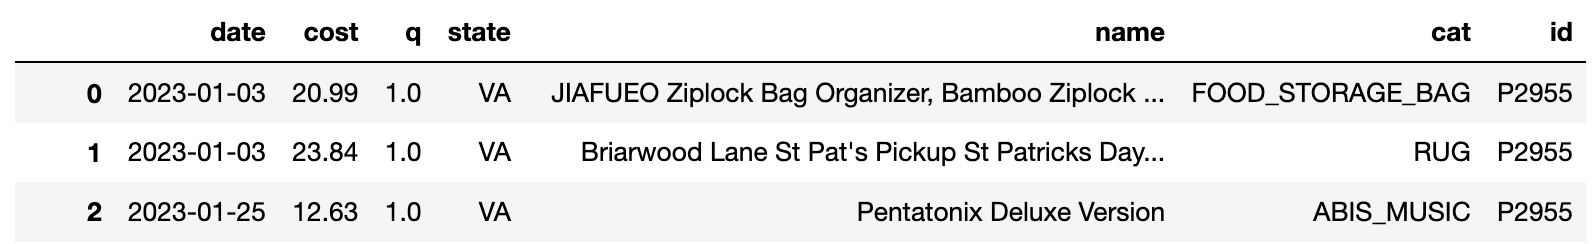
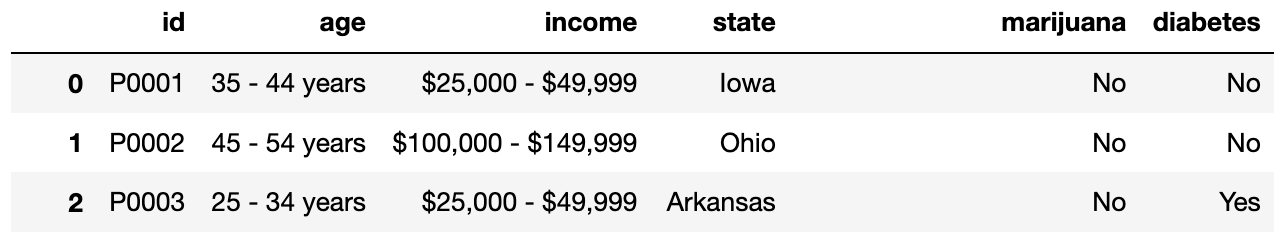
Fill in Python code below so that the last line of each code snippet
evaluates to each desired result, using the df and
survey DataFrames described on Page 1 of the Reference
Sheet. You may not use for or while
loops in any answer for this question. For convenience, the
first few rows of df (top) and survey (bottom)
are displayed below.
Find the participant ID of the person who made the most recent purchase in the dataset.
df.sort_values(__(a)__, ascending=True).iloc[__(c)__, __(b)__]Answer:
(a): date
(b): -1
(c): -1
Create a DataFrame that compares the range of item costs for people
with diabetes and people that don’t have diabetes. The DataFrame should
be indexed by the unique values in the diabetes column (Yes
and No) and have one column: the range of item costs (max cost - min
cost) for each group.
def f(x):
    return __(a)__

(df.merge(survey, on='id')
   .groupby(__(b)__)[__(c)__]
.__(d)__(f))Answer:
(a): x.max() - x.min()
(b): 'diabetes'
(c): 'cost'
(d): agg
What is the most likely missingness mechanism for the
state column in df?
Missing by design
Missing completely at random
Missing at random
Not missing at random
Answer: Missing by design
What is the most likely missingness mechanism for the
income column in survey?
Missing by design
Missing completely at random
Missing at random
Not missing at random
Answer: Missing at random
The code snippet below uses a for loop.
mystery = 0
for i in df['id'].unique():
    temp = df[df['id'] == i]
    if temp['q'].sum() > 100:
mystery += 1Rewrite the snippet without using any loops.
mystery = (df.groupby(__(a)__)
           .__(b)__(lambda x: __(c)__)
[__(d)__].__(e)__())Answer:
(a): 'id'
(b): filter
(c): x['q'].sum() > 100
(d): 'id'
(e): nunique
Suppose you see the output below:
>>> df['id'].value_counts()
P2955    200
P3001    150
P3125    100
Name: id, Length: 3, dtype: int64
Fill in the blank in the sentence below with a single number.
The code without for loops runs approximately _______
times faster than the code with a for loop.
Answer: 3
You want to use regular expressions to extract out the number of ounces from the 5 product names below.
| Index | Product Name | Expected Output |
|---|---|---|
| 0 | Adult Dog Food 18-Count, 3.5 oz Pouches | 3.5 |
| 1 | Gardetto’s Snack Mix, 1.75 Ounce | 1.75 |
| 2 | Colgate Whitening Toothpaste, 3 oz Tube | 3 |
| 3 | Adult Dog Food, 13.2 oz. Cans 24 Pack | 13.2 |
| 4 | Keratin Hair Spray 2!6 oz | 6 |
The names are stored in a pandas Series called names.
For each snippet below, select the indexes for all the product names
that will not be matched correctly.
Snippet:
regex = r'([\d.]+) oz'
names.str.findall(regex)
0
1
2
3
4
All names will be matched correctly.
Answer: 1
Snippet:
regex = r'(\d+?.\d+) oz|Ounce'
names.str.findall(regex)
0
1
2
3
4
All names will be matched correctly.
Answer: 1, 2, 4
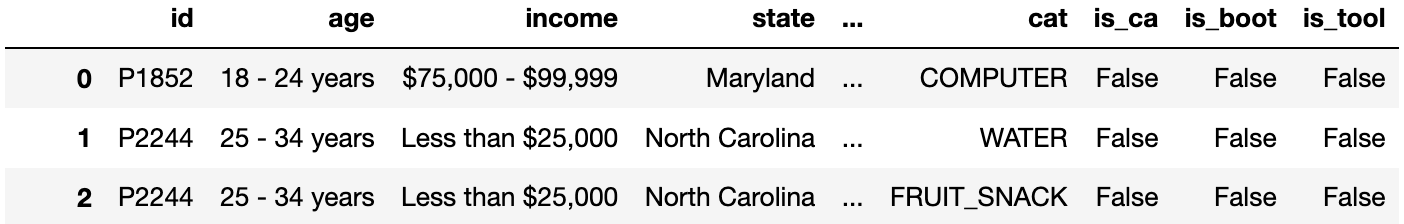
Suppose you define a DataFrame t as follows:
t = (survey.merge(df, on='id', suffixes=('', '2'))
     .assign(is_ca=t['state'] == 'California',
             is_boot=t['cat'] == 'BOOT',
             is_tool=t['cat'] == 'TOOLS'))
The first few rows of t are shown below:
For each pivot table below, state whether it is possible to observe Simpson’s paradox without any extra information about the data.
Pivot table:
t.pivot_table(
    index='is_ca',
    columns='is_boot',
    values='cost',
    aggfunc='count',
)
Yes
No
Need more information to determine
Answer: No
Pivot table:
t.pivot_table(
    index='is_ca',
    columns='is_tool',
    values='cost',
    aggfunc='mean',
)
Yes
No
Need more information to determine
Answer: Yes
For each hypothesis test below, select the one correct procedure to simulate a single sample under the null hypothesis, and select the one test statistic that can be used for the hypothesis test among the choices given.
For convenience, the first few rows of df (top) and
survey (bottom) are displayed below; see your Reference
Sheet for the full details.
Null: Every purchase is equally likely to happen in all 50 states.
Alternative: At least one state is more likely to have purchases than others.
Simulation procedure:
np.random.multinomial(len(df), [1/50] * 50)
np.random.multinomial(len(survey), [1/50] * 50)
np.random.multinomial(len(df), [1/2] * 2)
np.random.permutation(df['state'])
Test statistic:
Difference in means
Absolute difference in means
Total variation distance
K-S test statistic
Answer:
Simulation procedure:
np.random.multinomial(len(df), [1/50] * 50)
Test statistic: Total variation distance
Null: The income distribution of people who smoke marijuana is the same as the income distribution for people who don’t smoke marijuana.
Alternative: The income distributions are different.
Simulation procedure:
np.random.multinomial(len(survey), [1/50] * 50)
np.random.multinomial(len(survey), [1/2] * 2)
np.random.permutation(survey['income'])
Test statistic:
Difference in means
Absolute difference in means
Total variation distance
K-S test statistic
Answer:
Simulation procedure:
np.random.permutation(survey['income'])
Test statistic: Total variation distance
Null: The distribution of prices for items with missing categories is the same as the distribution of prices for items with recorded categories.
Alternative: Items with missing categories are more expensive than items with with recorded categories.
Simulation procedure:
np.random.multinomial(len(df), [1/50] * 50)
np.random.multinomial(len(df), [1/2] * 2)
np.random.permutation(df['cost'])
Test statistic:
Difference in means
Absolute difference in means
Total variation distance
K-S test statistic
Answer:
Simulation procedure:
np.random.permutation(df['cost'])
Test statistic: Difference in means
Suppose that df doesn’t have any missing data in the
cost column. Sam accidentally loses values from the
cost column and values are more likely to be missing for
states with expensive purchases. Sam’s data is stored in a
DataFrame called missing.
To recover the missing values, Sam applies the imputation methods
below to the cost column in missing, then
recalculates the mean of the cost column. For each
imputation method, choose whether the new mean will be lower (-), higher
(+), exactly the same (=), or approximately the same (\approx) as the original mean of the
cost column in df (the data without any
missing observations).
missing['cost'].fillna(missing['cost'].mean())None
None
=
\approx
Answer: -
def mystery(s):
    return s.fillna(s.mean())
missing.groupby('state')['cost'].transform(mystery).mean()
None
None
=
\approx
Answer: \approx
def mystery2(s):
    s = s.copy()
    n = s.isna().sum()
    fill_values = np.random.choice(s.dropna(), n)
    s[s.isna()] = fill_values
    return s

missing.groupby('state')['cost'].transform(mystery2).mean()
None
None
=
\approx
Answer: \approx
Suppose you are trying to scrape album names from a website. The website has an HTML table structured as follows:
<table><thead>
  <tr>
    <th>Name</th> <th>Price</th> <th>Number of Reviews</th>
  </tr></thead>
<tbody>
  <tr class="row">
    <td>Radical Optimism</td> <td>25</td> <td>10000</td>
  </tr>
  <tr class="row">
    <td>Hit Me Hard and Soft</td> <td>30</td> <td>12000</td>
  </tr>
  <tr class="row">
    <td>SOS</td> <td>18</td> <td>30000</td>
  </tr>
  <!-- 997 <tr> elements omitted -->
</tbody>
</table>
Notice that the <tbody> tag contains 1000
<tr> elements, but only the first three are shown
above. Suppose that you’ve read the HTML table above into a
BeautifulSoup object called soup. Fill in the code below so
that the albums variable contains a list of all the album
names with (strictly) more than 15,000 reviews.
albums = []
for tag in soup.find_all(___(a)___):
    reviews = int(___(b)___)
    if reviews > 15000:
        album = ___(c)___
albums.append(album)What should go in blank (a)?
Answer: class_="row"
What should go in blank (b)?
Answer: tag.find_all('td')[2].text
What should go in blank (c)?
Answer: tag.find('td').text
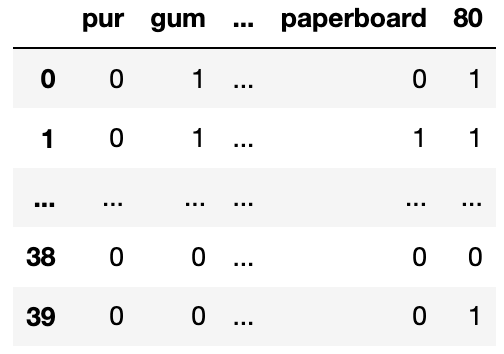
You create a table called gums that only contains the
chewing gum purchases of df, then you create a bag-of-words
matrix called bow from the name column of
gums. The bow matrix is stored as a DataFrame
shown below:
You also have the following outputs:
>>> bow_df.sum(axis=0)    >>> bow_df.sum(axis=1)    >>> bow_df[0, 'pur']
pur            5          0     21                  0
gum           41          1     22
sugar          2          2     22                  >>> (bow_df['paperboard'] > 0).sum()
              ..                ..                  20
90             4          37    22
paperboard    22          38    10                  >>> bow_df['gum'].sum()
80            20          39    17                  41
Length: 139               Length: 40
For each question below, write your answer as an unsimplified math expression (no need to simplify fractions or logarithms) in the space provided, or select “Need more information” if there is not enough information provided to answer the question.
What is the TF-IDF for the word pur in document 0?
Answer: 0
What is the TF-IDF for the word gum in document 0?
Answer: Need more information
What is the TF-IDF for the word paperboard in document
1?
Answer: \frac{1}{22} \log \left(\frac{40}{20} \right) = \frac{1}{22}
The two plots below show the total number of boots (top) and sandals
(bottom) purchased per month in the df table. Assume that
there is one data point per month.
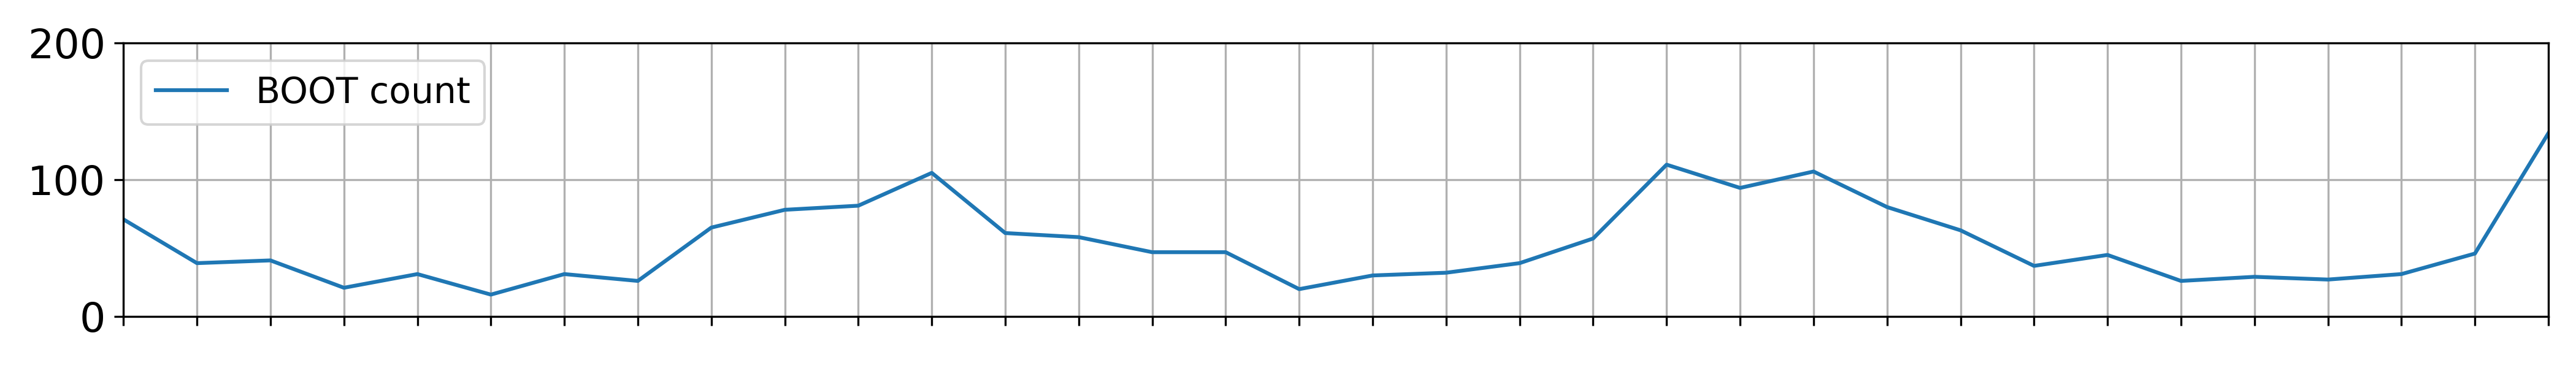
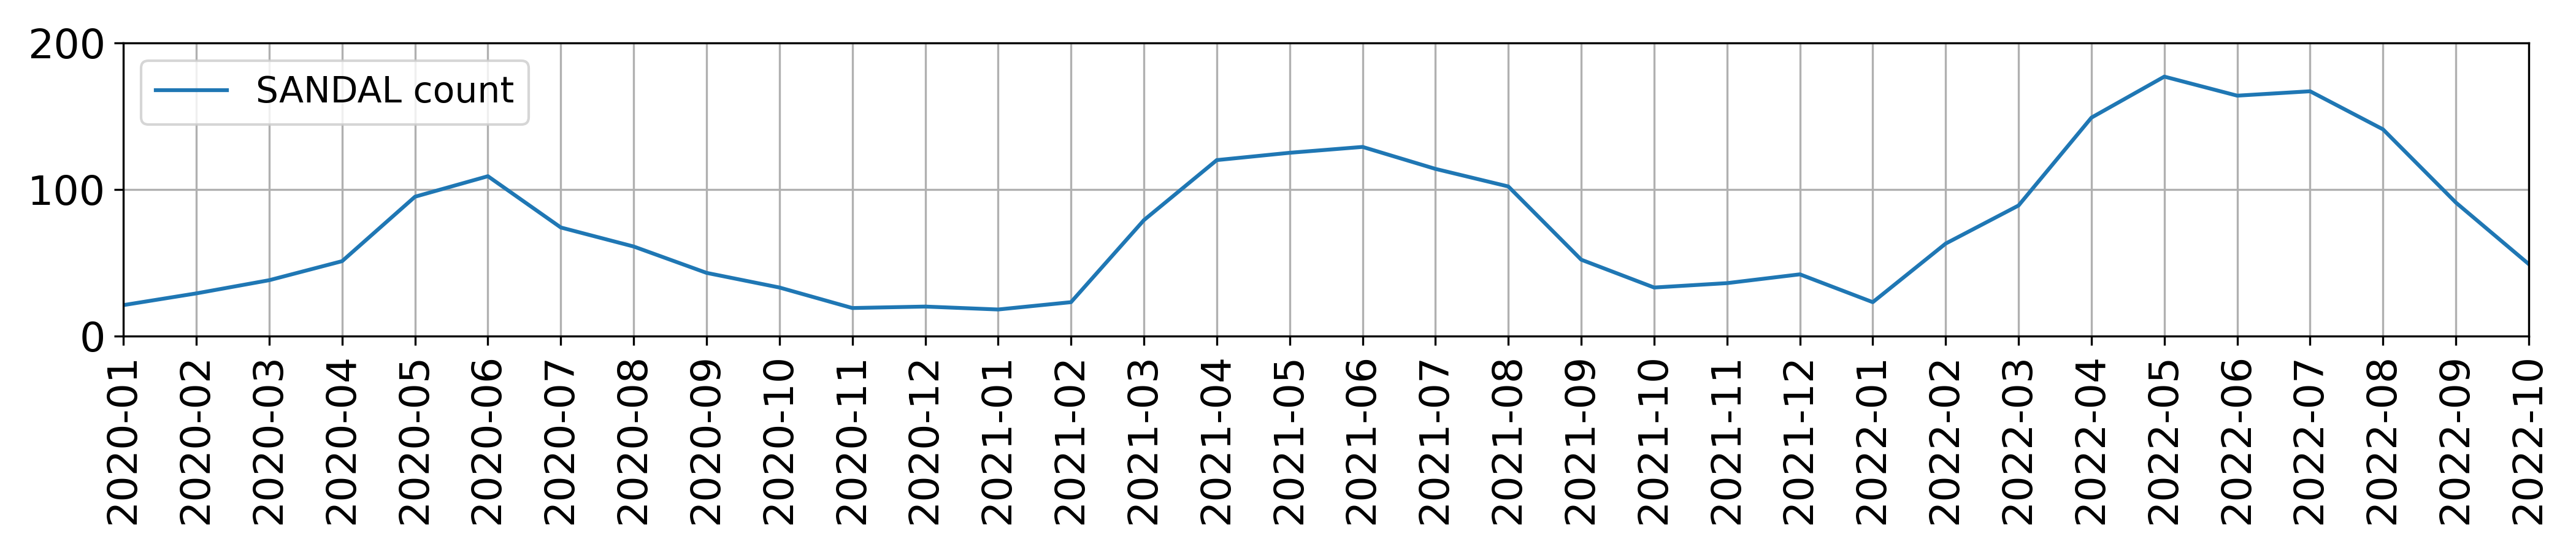
For each of the following regression models, use the visualizations shown above to select the value that is closest to the fitted model weights. If it is not possible to determine the model weight, select “Not enough info”. For the models below:
boot refers to the number of boots
sold.sandal refers to the number of sandals
sold.summer=1 is a column with value 1 if the month is
between March (03) and August (08), inclusive.winter=1 is a column with value 1 if the month is
between September (09) and February (02), inclusive.boot = w_0
w_0:
0
50
100
Not enough info
Answer: 50
boot = w_0 + w_1 \cdot
\text{sandal}
w_0:
-100
-1
0
1
100
Not enough info
w_1:
-100
-1
1
100
Not enough info
Answer:
w_0: 100
w_1: -1
boot = w_0 + w_1 \cdot
(\text{summer=1})
w_0:
-100
-1
0
1
100
Not enough info
w_1:
-80
-1
0
1
80
Not enough info
Answer:
w_0: 100
w_1: -80
sandal = w_0 + w_1 \cdot
(\text{summer=1})
w_0:
-20
-1
0
1
20
Not enough info
w_1:
-80
-1
0
1
80
Not enough info
Answer:
w_0: 20
w_1: 80
sandal = w_0 + w_1 \cdot
(\text{summer=1}) + w_2 \cdot (\text{winter=1})
w_0:
-20
-1
0
1
20
Not enough info
w_1:
-80
-1
0
1
80
Not enough info
w_2:
-80
-1
0
1
80
Not enough info
Answer:
w_0: Not enough info
w_1: Not enough info
w_2: Not enough info
Suppose you fit four different models to predict whether someone has an income greater than $100,000 a year using their purchase history. You split the data into a training and test set and use 3-fold cross-validation. The table below shows all the calculated accuracies for each model (higher accuracy is better).
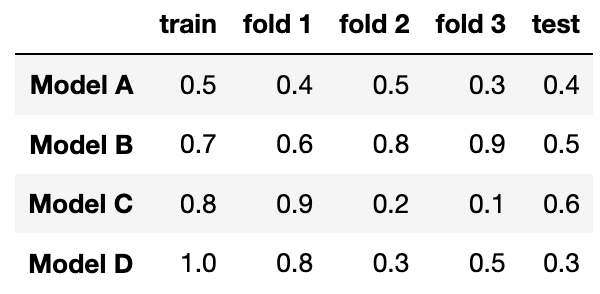
Which model has the lowest model bias?
Model A
Model B
Model C
Model D
Answer: Model D
Which model most severely underfits the data?
Model A
Model B
Model C
Model D
Answer: Model A
Which model most severely overfits the data?
Model A
Model B
Model C
Model D
Answer: Model D
Which model should you pick overall?
Model A
Model B
Model C
Model D
Answer: Model B
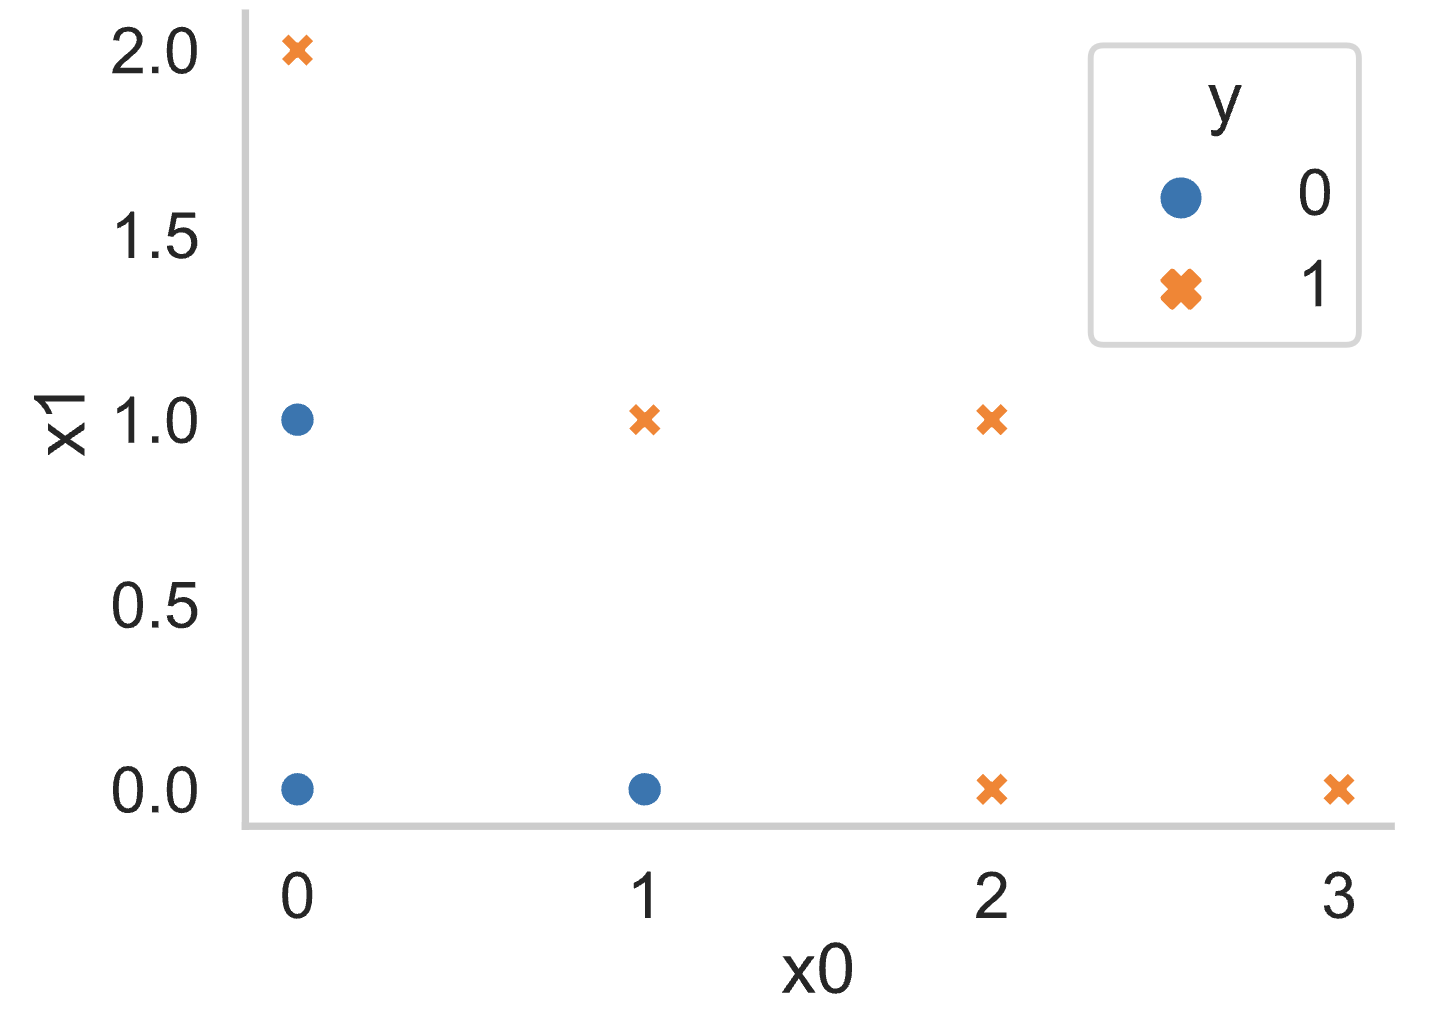
Suppose you fit a decision tree to the training set below, using the
features x0 and x1 to predict the outcome
y.
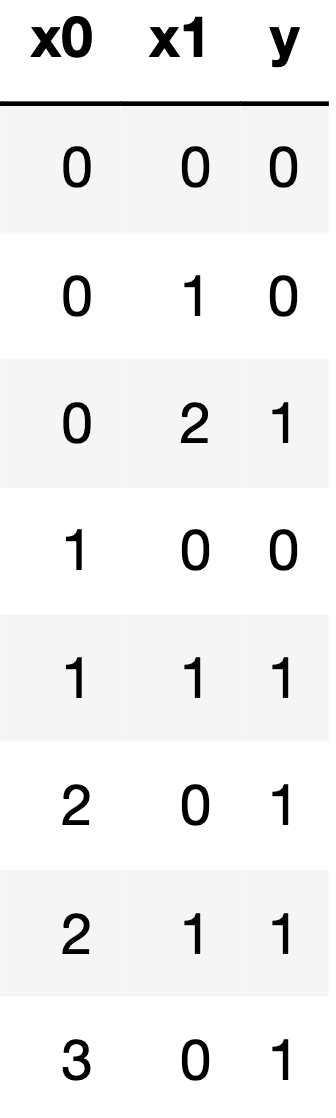
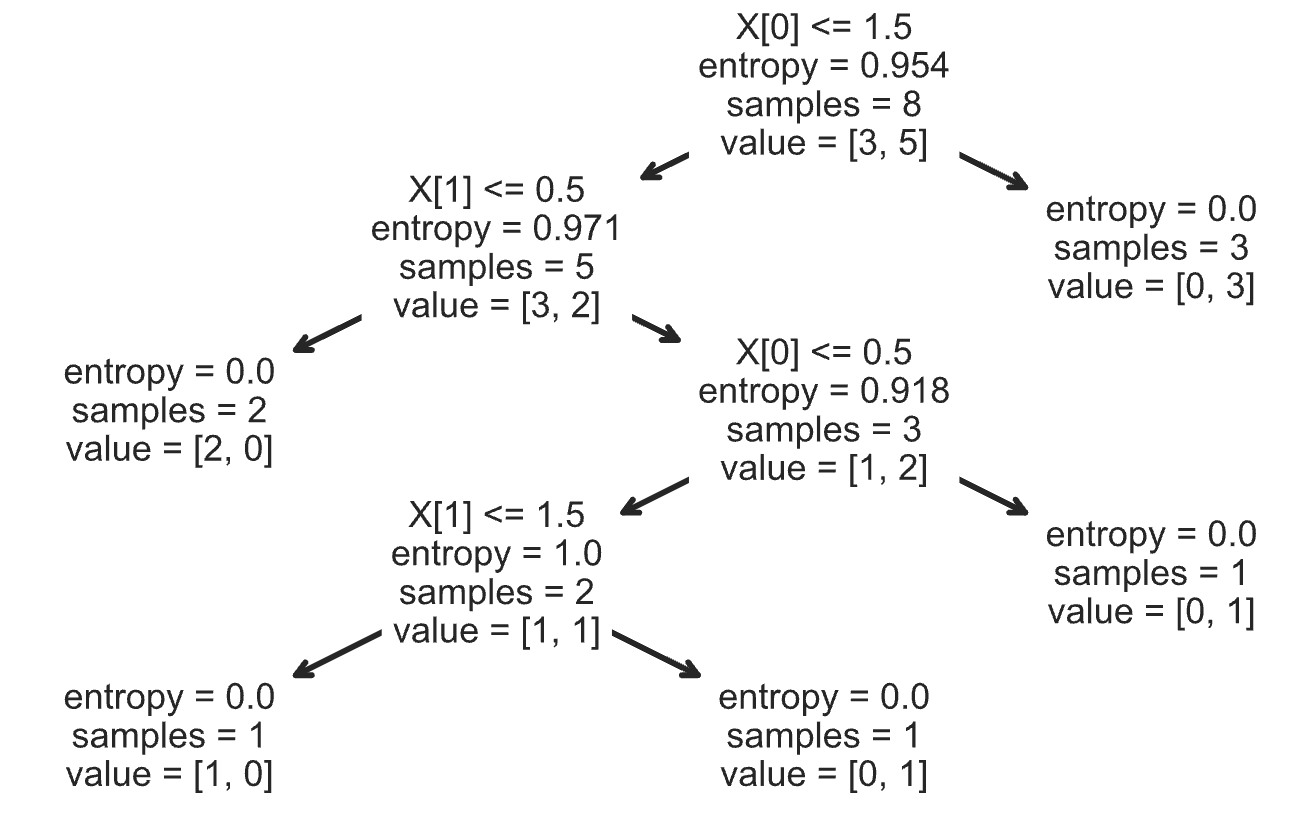
Write the first four splitting rules that are created by the decision
tree when fitting this training set (using weighted entropy). Assume
that the tree is constructed in a depth-first order. If two candidate
splits have the same weighted entropy, choose the one that splits on
x0.
The first splitting rule is:
___(i)___ <= ___(ii)___
(i):
x0
x1
(ii):
0
1
2
3
Answer:
(i): x0
(ii): 1
The second splitting rule is:
___(i)___ <= ___(ii)___
(i):
x0
x1
(ii):
0
1
2
3
Answer:
(i): x1
(ii): 0
The third splitting rule is:
___(i)___ <= ___(ii)___
(i):
x0
x1
(ii):
0
1
2
3
Answer:
(i): x0
(ii): 0
The fourth splitting rule is:
___(i)___ <= ___(ii)___
(i):
x0
x1
(ii):
0
1
2
3
Answer:
(i): x1
(ii): 1
Here is a plot of the training data:
Here is a plot of the fitted tree (from scikit-learn):
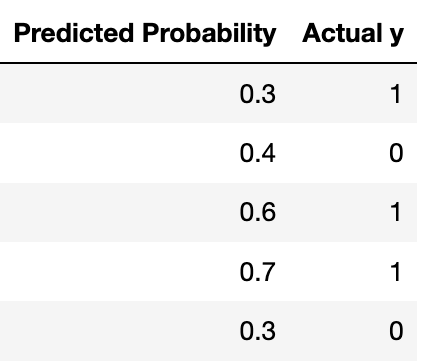
Suppose you fit a logistic regression classifier. The classifier’s predictions on a test set of 5 points are shown below, along with the actual labels.
Recall that for logistic regression, we must also choose a threshold
$ \tau $ to convert the predicted probabilities to
predicted labels. For this question, assume that
$ 0 < \tau < 1 $. Precision is undefined when the
classifier doesn’t make any positive predictions (since
$\frac{0}{0}$ is undefined). For each question, show your
work and draw a box around your final answer in the space provided. Each
of your final answers should be a single number.
What is the lowest possible precision for any
threshold $ \tau $?
Answer:
The lowest precision happens when $ \tau $ is less than
0.3. In this case, the classifier predicts all points are 1, which gives
a precision of $ \frac{3}{5} $.
What is the lowest possible recall for any threshold
$ \tau $?
Answer:
The lowest recall happens when $ \tau $ is greater than
0.7. In this case, the classifier predicts all points are 0, which gives
a recall of 0.
What is the highest possible recall if the classifier achieves a precision of 1?
Answer:
If precision is 1, the threshold must be greater than 0.4. Of these thresholds, the recall is greatest when the threshold is between 0.4 and 0.6. In this case, the recall is \frac{2}{3}.