
← return to practice.dsc80.com
Instructor(s): Tauhidur Rahman
This exam was administered in-person. The exam was closed-notes, except students were allowed to bring two two-sided cheat sheets. No calculators were allowed. Students had 180 minutes to take this exam.
Consider the following Code Snippet:
re.findall(r'__(a)__', 'my cat is hungry, concatenate!, catastrophe! What a cat!')
Which regular expression in __(a)__ will generate
the following output? Output: ['my', 'a']
\b([a-z]*)cat\b
\b[a-z]*\scat\b
([a-z]*)\scat\b
\b([a-z]*\scat)\b
Answer: C - ([a-z]*)\scat\b
This regular expression selects the sections of matches that consist
of zero or more lowercase letters that are followed by a space and then
followed by cat as a whole word (not with cat as a substring of a larger
word), essentially selecting words followed by a space and the word cat.
Thus this option correctly selects ['my', 'a'].
Option 1 would select ['', '']
Option 2 would select ['my cat', 'a cat']
Option 4 would select ['my cat', 'a cat']
Which regular expression in __(a)__ will generate the following output?
Output: ['concatenate']
\b.*cat.*\b
[a-z]*cat[a-z]*
[a-z]+cat[a-z]+
\b[a-z]*cat[a-z]*\b
Answer: C - [a-z]+cat[a-z]+
This regular expression selects matches where one or more lowercase
letters are followed by the substring cat, and then followed by one or
more lowercase letters, essentially selecting words with cat as a
substring but not a prefix. Thus this option correctly selects
['concatenate'].
Option 1 would select
['my cat is hungry, concatenate!, catastrophe! What a cat']
Option 2 would select
['cat', 'concatenate', 'catastrophe', 'cat']
Option 4 would select
['cat', 'concatenate', 'catastrophe', 'cat']
Which regular expression in __(a)__ will generate the following output?
Output: ['cat', 'concatenate', 'catastrophe', 'cat']
.*cat.*
\b.*cat.*\b
\b[a-z]*cat[a-z]*\b
\b[a-z]+cat[a-z]+\b
Answer: C - \b[a-z]*cat[a-z]*\b
This regular expression selects matches where a word boundary is
followed by 0 or more lowercase letters, cat, and then follwoed by 0 or
more lowercase letters followed by a word coundary, essentially
selecting words containing cat. Thus this option correctly selects
['cat', 'concatenate', 'catastrophe', 'cat'].
Option 1 would select
['my cat is hungry, concatenate!, catastrophe! What a cat!']
Option 2 would select
['my cat is hungry, concatenate!, catastrophe! What a cat!']
Option 4 would select ['concatenate']
Sam Altman has trained a Logistic Regression model to classify emails into “Spam” / “Non-Spam” categories/classes. Here, ‘Spam’ is the positive class. Once the model is trained, Sam opted to evaluate the model performance on the testing set. The Logistic Regression outputs a value between 0 and 1. When the output of the Logistic Regression model is greater than or equal to the threshold, the email is classified as a ‘Spam’ email. By varying the threshold, Sam creates the following Precision-Recall graph.
Which point corresponds to the highest threshold value?
A
B
C
D
Answer: B
Remember that precision measures the predicted positive values that were actually positive, while recall measures actually positive values that were predicted as being positive. The highest threshold is 1, and we would expect that when the model predicts 1 the email is actually likely Spam, but that the model does not predict 1 for every Spam email. This means that at the highest threshold, precision is almost perfect while recall is extremely low, corresponding to point B on the plot.
Consider the following confusion matrix with “Spam” and “Not Spam” classes where ‘Spam’ is the positive class.
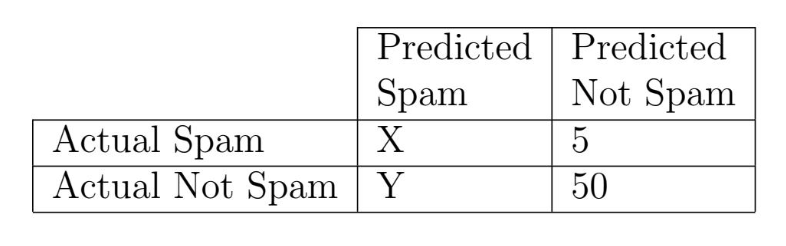
Suppose the recall of Sam’s classifier is 0.75 and the precision of Sam’s classifier is 0.6. What are the values of X and Y? Give your answers as positive integers.
Answer: X = 15, Y = 10
We are given that FN = 5 and TN = 50
Remember that Precision =
\frac{TP}{(TP+FP)} and Recall =
\frac{TP}{(TP+FN)}
To calculate TP (X) use the formula for recall:
0.75 = \frac{TP}{(TP+5)}
0.75 \cdot (TP+5)* = TP
0.75 \cdot TP+ 5 \cdot 0.75 = TP
0.25 \cdot TP = 3.75
TP = 15
Therefore X = 15
To calculate FP (Y) use the formula for precision:
0.6 = \frac{15}{(15+FP)}
0.6 \cdot (15+FP)* = 15
0.6 \cdot 15 + 0.6 \cdot FP = 15
0.6 \cdot FP = 6
FP = 10
Therefore Y = 10
Suppose you want to predict if people are depressed based on their Electrocardiogram ECG signal. To train your model, you sampled ECG data from 100 people, with 80% of them not being depressed. Which of the following metrics is definitely not suitable for evaluating this binary classification model? Select all that apply.
Precision
Recall
Accuracy
F1 Score
Answer: Accuracy
Because the the data set is imbalanced (80% of the data belongs to one class), accuracy is not a suitable metric to evaluate this classification model. This is because accuracy does not differentiate between if the accuracy was achieved on predictions made for the majority or the minority class, and it is highly likely in a biased dataset that a high accuracy is achieved based on making correct predictions solely for the majority, but not the minority class.
For the purposes of such a binary depression classification task, which is more important?
high precision
high recall
Answer: High recall
High recall is relatively more important for medical tests generally. High recall minimizes FN, while high precision minimizes FP. A high recall ensures that you are capturing the people who have the condition, and it is usually worse in these settings to think someone does not have a condition when they actually do, than the other way around. If your system fails to detect the condition, the condition goes undiagnosed and unaddressed, so it is more important to minimize FN.
For the purposes of determining whether someone committed a crime, which is more important?
high precision
high recall
Answer: High precision
High precision is relatively more important since you do not want to punish someone who did not commit the crime (want to minimize FP). See the previous explanation for more details about the differences between high recall and high precision.
In the context of a spam detector, an important email from a legitimate source ending up in one’s spam folder is an example of what?
True positive
False positive
False negative
True negative
Answer: False positive
For a spam detector, detetcted an email as Spam is equivalnet to assigning it as belonging to the positive class. Since the email was classified by the spam detector as spam, it is positive. However, since it was not actually spam, it is a false positive.
Suraj is exploring the relationship between the applied voltage and
resulting current of an electrical element called Diode. At first, he
decides to fit a Linear Regression model on some training data stored in
DataFrame diode. diode has two columns, named
"Voltage" and "Current", respectively.
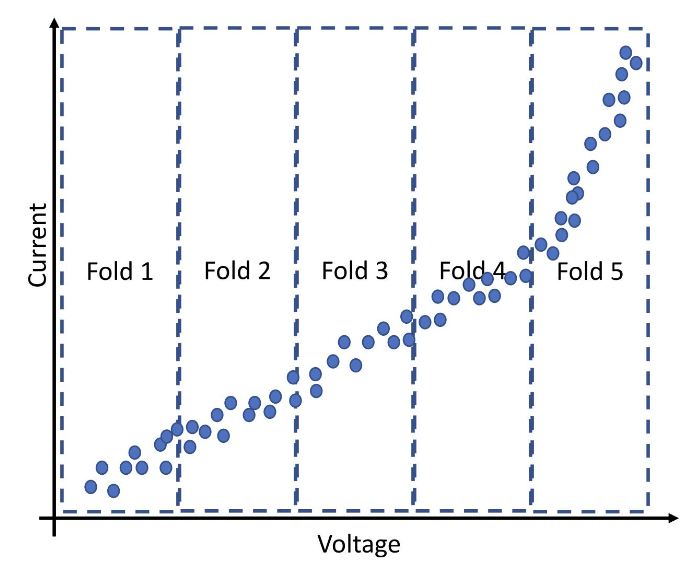
In the following code, Suraj implements k-fold cross validation. He
stores all the validation root mean squared error (RMSE) values of each
fold in errs_dataframe Dataframe.
errs = cross_val_score(LinearRegression(), diode[['voltage']], diode['current'], cv=5, scoring='neg_root_mean_squared_error')

errs_dataframe = pd.DataFrame(-errs,columns=['rmse'], index=[f'Fold {i}' for i in range(1, 6)])

errs_dataframe
Based on the information in errs_dataframe, which one is
a true statement?
The validation RMSE of Fold 5 is the lowest.
The validation RMSE of Fold 5 is the highest.
The validation RMSE of Fold 1 is significantly higher than the validation RMSE of fold 5.
The validation RMSE of all the folds (i.e., Fold 1-5) are similar to each other.
Answer: B - The validation RMSE of Fold 5 is the highest.
To answer this question, we can use the plot showing the actual data in each fold, along with the fact that we are fitting a linear regression model. We can see that a line fitted on all the folds would likely fit datapoints from the fifth fold worse than points from the first four folds. This is because the first four folds appear to fall along a relatively linear pattern amongst themselves, compared to when the fifth fold is included in our considerations. Thus the validation RMSE would be highest for the fifth fold.
Consider the following piece of code where we implement a hyperparameter search with GridSearchCV():
from sklearn.model_selection import GridSearchCV
from sklearn.tree import DecisionTreeClassifier
from sklearn.model_selection import train_test_split

diabetes = pd.read_csv('data/diabetes.csv')

X_train, X_test, y_train, y_test = train_test_split(diabetes[['Glucose', 'BMI']], diabetes['Outcome'])

hyperparameters = {
'max_depth': [2, 3, 4, 5, 7, 10, 13, 15, 18, None],
'min_samples_split': [2, 5, 10, 20, 50],
'criterion': ['gini', 'entropy']
}

searcher = GridSearchCV(DecisionTreeClassifier(), hyperparameters, cv=8)
searcher.fit(X_train, y_train)
In total, how many decision tree models were trained under the hood for this hyperparameter search?
8
100
200
800
1600
Answer: 800
The code specifies 10 options for max_depth, 5 options
for max_depth, 2 options for criterion, and
the cross validation parameter in GridSearchCV is set to 8. Therefore
the total number of trained models is equal to the total number of
combinations of max_depth, max_depth, and
criterion, times 8 for the number of cross validation
folds:
10 \cdot 5 \cdot 2 \cdot 8 = 800
Consider the same piece of code from the previous problem.
After fitting the searcher, you run the following line of code. What would this line of code evaluate to?
searcher.cv_results_['mean_test_score'].shape[0]8
100
200
800
1600
Answer: 100
Taking the mean test score from all 8 cross validation folds for the
models gives 1 value for each combination of max_depth,
max_depth, and criterion. Therefore the code
will evaluate to the total number of combinations of
max_depth, max_depth, and
criterion:
10 \cdot 5 \cdot 2 = 100
Rahul is trying to scrape the website of an online bookstore ‘The Book Club’.
<HTML>
<H1>The Book Club</H1>
<BODY BGCOLOR="FFFFFF">
Email us at <a href="mailto:support@thebookclub.com">
support@thebookclub.com</a>.

<div>
    <ol class="row">
    <li class="book_list">

        <article class="product_pod">
            <div class="image_container">
                    <img src="pic1.jpeg" alt="A Light in the Attic"
                    class="thumbnail">
            </div>

            <p class="star-rating Three"></p>

            <h3>
            <a href="cat/index.html" title="A Light in the Attic">
            A Light in the Attic
            </a>
            </h3>

            <div class="product_price">
                <p class="price_color">£51.77</p>

                <p class="instock availability">
                    <i class="icon-ok"></i>
                    In stock
                </p>

            </div>
        </article>
    </li>
    </ol>

</div>
</BODY>
</HTML>
Which is the equivalent Document Object Model (DOM) tree of this HTML file?
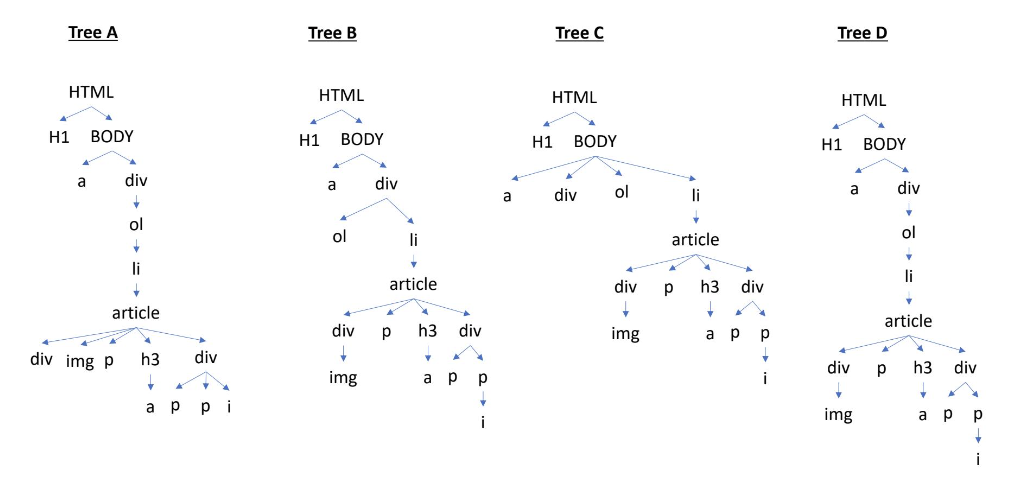
Tree A
Tree B
Tree C
Tree D
Answer: Tree D
Following tree D in the image from top to bottom, we can follow the nesting of tags in the HTML file to verify that the DOM tree D matches the syntax of the HTML file.
Rahul wants to extract the ‘instock availability’ status
of the book titled ‘A Light in the Attic’. Which of the following
expressions will evaluate to "In Stock"? Assume that Rahul
has already parsed the HTML into a BeautifulSoup object stored in the
variable named soup.
Code Snippet A
    soup.find('p',attrs = {'class': 'instock availability'})\
    .get('icon-ok').strip()
Code Snippet B
soup.find('p',attrs = {'class': 'instock availability'}).text.strip()Code Snippet C
    soup.find('p',attrs = {'class': 'instock availability'}).find('i')\
    .text.strip()
Code Snippet D
    soup.find('div', attrs = {'class':'product_price'})\
    .find('p',attrs = {'class': 'instock availability'})\
.find('i').text.strip()Answer: Code Snippet B
Code Snippet B is the only option that finds the tag p
with the attribute class being equal to
instock availability and then getting the text contained in
that tag, which is equal to ‘instock availability’.
Option A will cause an error because of .get('icon-ok')
since 'icon-ok' is not the name of the attribute, but is
instead the value of the class attribute.
Option C and D will both get the text of the i tag,
which is '' and is therefore incorrect.
Rahul also wants to extract the number of stars that the book titled
‘A Light in the Attic’ received. If you look at the HTML file, you will
notice that the book received a star rating of three. Which code snippet
will evaluate to "Three"?
Code Snippet A
soup.find('article').get('class').strip()Code Snippet B
soup.find('p').text.split(' ')Code Snippet C
soup.find('p').get('class')[1]None of the above
Answer: Code Snippet C
Code Snippet C finds the first occurence of the tag p,
gets the contents of its class attribute as a list, and
returns the last element, which is the rating 'Three' as
desired.
Option A will error because .get('class') returns
['product_pod'] and strip cannot be used on a list, but
also the content of the list does not bring us closer to the desired
result.
Option B gets the text contained within the first p tag
as a list, which is [''].
Which are examples of nested data formats? Select all that apply.
XML
CSV
JSON
HTML
Answer: XML, JSON, HTML
CSV is not a nested data format, but is in a flat format, representing data in a 2d structure.
To measure the similarity between two word vectors \vec{a} and \vec{b}, we compute their normalized dot product, also known as their cosine similarity.
\text{Cosine Similarity} = \cos \theta = \boxed{\frac{\vec{a} \cdot \vec{b}}{|\vec{a}| | \vec{b}|}}
Which equation describes the cosine distance metric?
\cos \theta - 1
1- \cos \theta
\cos \theta \cdot |\vec{a}| | \vec{b}|
(\cos \theta)^{-1}
Answer: 1 - cos(\theta)
Cosine similarity ranges from 0 to 1, and therefore cosine dissimilarity (or distance) must be the difference between 1 and the cosine similarity (consider that cosine similarity of 0 should mean distance of 1, and vice versa). Therefore cosine distance is 1 - cos(\theta).
Chen downloaded 4 independent reviews of a new vacuum cleaner from Amazon (as shown in the 4 sentences below).
    Sentence 1: 'if i could give this vacuum zero stars i would'
    Sentence 2: 'i will not order again this vacuum is garbage'
    Sentence 3: 'Love Love Love i love this product'
    Sentence 4: 'this little vacuum is so much fun to use i love it'
X is the ‘Term frequency-Inverse Document Frequency (TF-IDF)’ of the word ‘vacuum’ in sentence 1.
Chen replaces sentence 3 with the following new sentence/review.
New Sentence 3: 'Love Love Love i love this vacuum'Y is the ‘TF-IDF’ of the word ‘vacuum’ in sentence 1 after the sentence 3 is replaced by the new sentence 3.
Given the above information, which of the following statements is true?
X=Y
X>Y>0
X>0 and Y=0
X>0 and Y>X
Answer: X > 0 & Y = 0
To find X:
TF = \frac{1}{10}
IDF = log_2\frac{4}{3}
TF-IDF \approx 0.415
So X > 0
To find Y:
TF = \frac{1}{10}
IDF = log_2\frac{4}{4}
TF-IDF = 0
So Y = 0
Consider the five expressions in the following Series, sentences.
sentences = pd.Series([
    'buffalo monkey giraffe buffalo buffalo buffalo',
    'buffalo giraffe',
    'giraffe monkey',
    'deer monkey',
    'buffalo'
])
We convert all the expressions in the sentences series to a bag of words representation with the following words (also known as dictionary):
{buffalo, monkey, giraffe, deer}Which expression will achieve the highest similarity with
sentences.iloc[0] if we use the un-normalized
dot product between the bag of words (i.e., \vec{a} \cdot \vec{b}) as the similarity
metric?
'buffalo giraffe'
'giraffe monkey'
'deer monkey'
'buffalo'
Answer: ‘buffalo giraffe’
Bag of words for sentences.iloc[0] (‘buffalo monkey
giraffe buffalo buffalo buffalo’) is (4, 1, 1, 0)
Bag of words and products for the expressions are:
‘buffalo giraffe’:
bow: (1, 0, 1, 0)
product: 5
‘giraffe monkey’:
bow: (0, 1, 1, 0)
product: 2
‘deer monkey’:
bow: (0, 1, 0, 1)
product: 1
‘buffalo’:
bow: (1, 0, 0, 0)
product: 4
So ‘buffalo giraffe’ maximizes the similarity metric.
Which expression will achieve the highest similarity with
sentences.iloc[0] if we use cosine
similarity between the bag of words as the similarity metric?
Hint: \sqrt{18}=3\sqrt{2},
\frac{2}{\sqrt{2}}=\sqrt{2}, 4\sqrt{2}=5.65*
'buffalo giraffe'
'giraffe monkey'
'deer monkey'
'buffalo'
Answer: ‘buffalo’
Bag of words for sentences.iloc[0] (‘buffalo monkey
giraffe buffalo buffalo buffalo’) is (4, 1, 1, 0), so the norm is \sqrt{18} = 3\sqrt{2}
Calculating the cosine similarity for each expression:
‘buffalo giraffe’:
bow: (1, 0, 1, 0)
similarity: \frac{5}{6}
‘giraffe monkey’:
bow: (0, 1, 1, 0)
similarity: \frac{1}{3}
‘deer monkey’:
bow: (0, 1, 0, 1)
similarity: \frac{1}{6}
‘buffalo’:
bow: (1, 0, 0, 0)
similarity: \frac{2\sqrt{2}}{3}
So ‘buffalo’ maximizes the similarity metric.
In this question, we will work with a publicly available forest fire
dataset. A preview of the forest DataFrame is provided
below, along with a description of the column names.
forest Dataframe:

"month" - month of the year: jan to dec
"day" - day of the week: mon to sun
"temp" - temperature in Celsius degrees: 2.2 to
33.30
"RH" - relative humidity in percentage: 15.0 to 100
"wind" - wind speed in km/h: 0.40 to 9.40
"rain" - outside rain in mm/m2 : 0.0 to 6.4
"area" - the burned area of the forest in logarithmic
scale
"is_julaugsep" - whether the forest fire event happened
in the months of July, August, or September.
Alex wants to explore if there is any statistically significant
relationship between the burned area of the forest "area"
and the "is_julaugsep" variable. At first, he plots the two
probability distributions (as shown in the figure below):

Alex decides to perform a permutation test with the following hypotheses.
Null Hypothesis: The burned area for forest fire events in the July-Aug-Sep months are drawn from the same distribution as the burned area for forest fire events in the rest of the year. Any observed differences are due to random chance.
Alternative Hypothesis: The forest fire events in the July-Aug-Sep months has lower average burned area than the forest fire events in the rest of the year.
Which one of the following is the best test statistic in this case?
Total Variation Distance (TVD) between the distributions
Kolmogorov-Smirnov (K-S) distance between the distributions
The signed difference between the mean burned area of Non-July-Aug-Sep months, minus the mean burned area of July-Aug-Sep months
The unsigned (absolute) difference between the mean burned area of Non-July-Aug-Sep months, minus the mean burned area of July-Aug-Sep months
Answer: C - The signed difference between the mean burned area of Non-July-Aug-Sep months, minus the mean burned area of July-Aug-Sep months.
Since the two distributions here are numerical (burned areas is numerical), and the shapes of the distributions are similar (based on the the probability density plot), we should use the signed difference in means as the test statistic.
Hasan noticed some missing data in the "temp" column.
After talking to Prof. Ana who lead the data collection efforts, Hasan
came to know that the temperature sensor had to be taken down and
re-calibrated in some of the high temperature days which resulted in
missing values. what can be said about the missingness in the
"temp" column?
Missing Completely at Random
Not Missing at Random
Missing at Random
Missing by Design
Answer: Not Missing at Random
The "temp" column is missing if its own value is too
high. Since missingness depends on itself, it is NMAR.
Now, Hasan wants to fill in the missing values in the
"temp" column. Which data imputation strategy is most
appropriate here?
Data imputation by random sampling where we randomly sample one value
from the observed values in the "temp" column for each
missing values in the same column
Mean imputation where we replace the missing value by mean of the
observed values in "temp" column
Conditional mean imputation based on "is_julaugsep"
column
Data imputation can not be performed based on the forest
dataframe
Answer: D - Data imputation can not be performed
based on the forest dataframe.
Since the missing value depends on itself (NMAR), there is no other
data in forest that can be used for imputation.
Mark, at first, trains a linear regression model with
"temp" and "RH" columns to predict
"area". Later, Mark identifies that dew point temperature
"Td" is an informative feature for predicting
"area". He adds a new column to the forest
Dataframe called "Td" where Td can be expressed by the
following equation: Td = temp -
\frac{100-RH}{5}. Lastly, Mark trains a second linear regression
model with "temp", "RH", "Td"
columns in order to predict "area". Based on this, what can
be said about the second model?
The accuracy of the second model is likely to be lower than the first one.
The coefficient of the second model can not be interpreted.
The performance (e.g., rmse or R2 value) of the second model will be the same as the first one.
The first linear regression model suffers from ‘Multicollinearity’
Answer: Options 2 and 3.
Because the variable Td is derived form a linear
combination of the features temp and RH, the
second model will have multicollinearity. This means that although the
performance of the second model will be the same as that of the first,
the coefficients of the second model cannot be interpreted, unlike in
the first model.
Therefore the correct answers are options 2 and 3.
Consider a DataFrame df containing sales data for a
company with the following columns: "Year",
"Month", "Product", "Region", and
"Revenue". The "Revenue" column represents the
sales revenue for each product in a specific region during a particular
month of a year. You want to create a pivot table to summarize the total
revenue for each product in each year. Which of the following options
correctly achieve this? Select all that apply.
Option A
pd.pivot_table(df, values='Revenue', index='Product',
columns='Year', aggfunc=np.sum)
Option B
pd.pivot_table(df, values='Revenue', index=['Year', 'Product'],
columns='Region', aggfunc=np.sum)
Option C
pd.pivot_table(df, values='Revenue', index=['Product', 'Year'],
columns='Month', aggfunc=np.sum)
Option D
pd.pivot_table(df, values='Revenue', index='Year',
columns='Product', aggfunc=np.sum)Answer: Options A and D
Options 1 and 4 have the same behavior, in that they create pivot
tables that display the sum of revenue for each product in each year
(index and column are interchangeable).
Options 3 and 4 are incorrect because they use columns such as
Region and Month that are not necessary to
generate the information that is desired in the pivot table.
Let’s consider the two DataFrames: timeuse1 and
timeuse2. Both DataFrames have 10 rows in it.

The following code uses pd.concat to combine the two
DataFrames.
    pd.concat([timeuse1.set_index('Country'),
        timeuse2.set_index('Country_name')], axis=1)
How many NaN values would the resulting DataFame have?
Answer: 20
The values in the index of timeuse1 that are not in
timeuse2 are Estonia, Spain, France, and Italy. These 4
indices contribute to 4 \cdot 3 = 12
NaN values in the concatenated DataFrame, since timeuse2
has 3 non-index columns.
The values in the index of timeuse2 that are not in
timeuse1 are Slovenia, Finland, United Kingdom, and Norway.
These 4 indices contribute to 4 \cdot 2 =
8 NaN values in the concatenated DataFrame, since
timeuse1 has 2 non-index columns.
So the total number of NaN values in the concatenated DataFrame is 12 + 8 = 20
The following code uses merge() to combine the two
DataFrames from the question above.
    timeuse1.merge(timeuse2, left_on='Country',
        right_on='Country_name', how='inner')
How many NaN values would the resulting DataFame have?
Answer: 0
The resulting DataFrame would have no NaN values. This is because the merged DataFrame used an inner merge, and would only contain rows with the same country name in both DataFrames, contributing non Nans, and none of the rows in either unmerged DataFrame starts off with NaN values.
What would the following code evaluate to?
    timeuse1.merge(timeuse2, left_on='Country',
right_on='Country_name', how='outer').shape[0]Answer: 14
Using an outer join results in a row for each unique country name across both datasets. This number is equal to 14, so the code above, which returns the number of rows in the outer joined DataFrame, would evaluate to 14.
A pharmaceutical company conducted a clinical trial to compare the efficacy of two drugs, Drug A and Drug B, in treating a specific medical condition. The trial involved two groups of patients, Group X and Group Y. The results of the trial are as follows:
Group X:
Group Y:
Based on these results, which drug would you conclude is more effective overall?
Drug A
Drug B
It is impossible to determine from the given data
The results are contradictory, and no conclusion can be made
Answer: Drug A
The overall success rate of drug A is \frac{120+70}{150+100} = \frac{190}{250}
The overall success rate of drug B is \frac{75+60}{300+200} = \frac{345}{500}
\frac{190}{250} > \frac{345}{500} so Drug A is likely more effective overall.
Justify your answer in words.
Answer: A trick question! Although the results may seem like an example of Simpson’s Paradox, it is not, because the trend within each group is consistent (A is always better) and A is more effective overall. Since we’re asked to determine which drug is more effective overall, we should calculate the success rate of Drug A and Drug B across both groups. The comparison is \frac{190}{250} > \frac{345}{500}, so Drug A is more effective overall.
Let’s recall Project 1, where the concept of redemption score was introduced. According to this idea, the course could reward for showing improvement in their understanding of the earlier ideas in the course on the final exam. Suppose the final exam was worth 80 points. A total of 40 points were associated with questions 2, 4, 6, 8, and 9, which were the redemption questions. The class’s mean score on just the redemption questions was 0.8, with a standard deviation of 0.2. Suppose the midterm exam was worth 70 points. The class’s mean score on the midterm exam was 0.6, with a standard deviation of 0.5. Tiffany, a student in the course, earned a \frac{60}{80} on the final exam, including a \frac{30}{40} on the redemption questions, and a \frac{50}{70} on the midterm exam.
Should her final exam score be replaced using the rule in Project 1?
Yes
No
Answer: No
Recall that z-score = \frac{score - mean}{standard\ deviation}
Tiffany’s raw redemption score: \frac{30}{40} Tiffany’s redemption z-score: \frac{\frac{30}{40} - 0.8}{0.2} = -0.25
Tiffany’s raw midterm score: \frac{50}{70} Tiffany’s midterm z-score: \frac{\frac{50}{70} - 0.6}{0.5} \approx 0.23
Since Tiffany’s redemption z-score is lower than her midterm z-score, she should not get her final exam score replaced.
Which metric did you use in Project 1 to conclude that?
Answer: z-score
Suppose Tony Stark has implemented a decision tree classifier from scratch and trained it using different criteria and maximum depths in a 10-fold cross-validation. Based on the results table below, which row (numbered 1 to 8) should he choose as his final model?
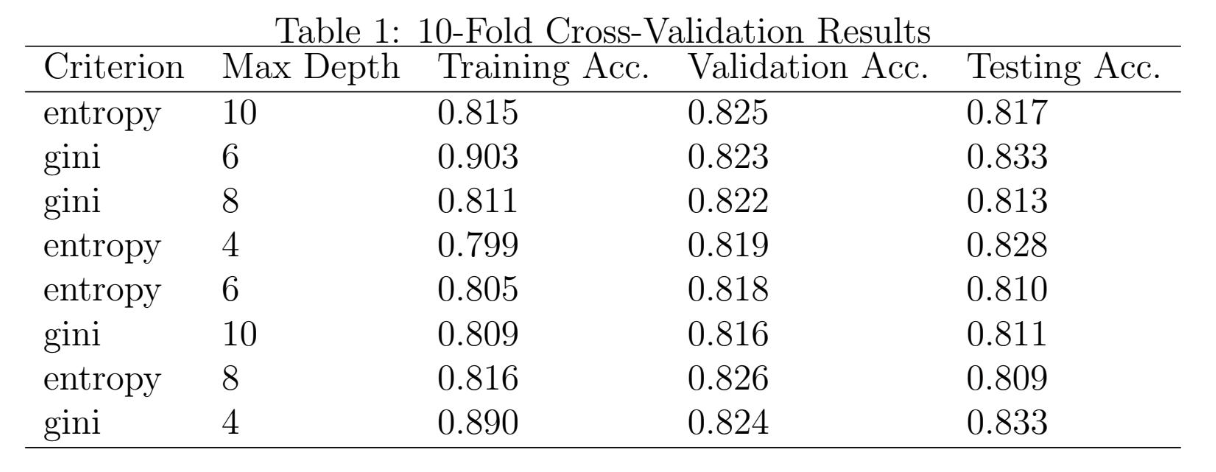
Answer: 7
The decision for the best selection of model hyperparameters in a cross validation is based on the how well the model performs on the validation data. the accuracy of the models on the test data in irrelevant, since that can only be found after a model is selected.
The model with the best performance on the validation data (highest accuracy on validation data), corresponds to the model indicated in row 7.