← return to practice.dsc80.com
Instructor(s): Suraj Rampure
This exam was administered in-person. The exam was closed-notes, except students were allowed to bring 2 two-sided cheat sheets. No calculators were allowed. Students had 180 minutes to take this exam.
Welcome to the Final Exam for DSC 80 in Spring 2022! For this exam, students had 3 hours, and could bring 2 two-sided cheat sheets.
For each day in May 2022, the DataFrame streams contains
the number of streams for each of the “Top 200" songs on Spotify that
day — that is, the number of streams for the 200 songs with the most
streams on Spotify that day. The columns in streams are as
follows:
"date": the date the song was streamed
"artist_names": name(s) of the artists who created
the song
"track_name": name of the song
"streams": the number of times the song was streamed
on Spotify that day
The first few rows of streams are shown below. Since
there were 31 days in May and 200 songs per day, streams
has 6200 rows in total.
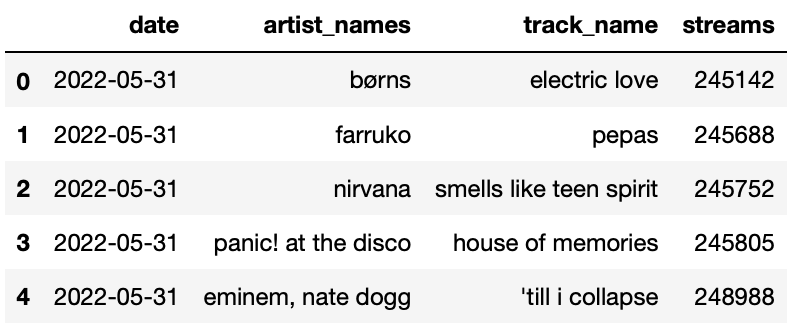
Note that:
streams is already sorted in a very particular way —
it is sorted by "date" in reverse chronological
(decreasing) order, and, within each "date", by
"streams" in increasing order.
Many songs will appear multiple times in streams,
because many songs were in the Top 200 on more than one day.
Complete the implementation of the function song_by_day,
which takes in an integer day between 1 and 31
corresponding to a day in May, and an integer n, and
returns the song that had the n-th most streams on
day. For instance,
song_by_day(31, 199) should evaluate to
"pepas", because "pepas" was the 199th most
streamed song on May 31st.
Note: You are not allowed to sort within
song_by_day — remember, streams is already
sorted.
def song_by_day(day, n):
    day_str = f"2022-05-{str(day).zfill(2)}"
    day_only = streams[__(a)__].iloc[__(b)__]
    return __(c)__
What goes in each of the blanks?
Answer: a) streams['date'] == day_str,
b) (200 - n), c) day_only['track_name']
The first line in the function gives us an idea that maybe later on
in the function we’re going to filter for all the days that match the
given data. Indeed, in blank a, we filter for all the rows in which the
'date' column matches day_str. In blank b, we
could access directly access the row with the n-th most
stream using iloc. (Remember, the image above shows us that the streams
are sorted by most streamed in ascending order, so to find the
n-th most popular song of a day, we simply do
200-n). Finally, to return the track name, we could simply
do day_only['track_name'].
The average score on this problem was 63%.
Below, we define a DataFrame pivoted.
pivoted = streams.pivot_table(index="track_name", columns="date",
                                values="streams", aggfunc=np.max)
After defining pivoted, we define a Series
mystery below.
mystery = 31 - pivoted.apply(lambda s: s.isna().sum(), axis=1)mystery.loc["pepas"] evaluates to 23. In one sentence,
describe the relationship between the number 23 and the song
"pepas" in the context of the streams dataset.
For instance, a correctly formatted but incorrect answer is “I listened
to the song "pepas" 23 times today."
Answer: See below.
pivoted.apply(lambda s: s.isna().sum(), axis=1) computes
the number of days that a song was not on the Top 200, so
31 - pivoted.apply(lambda s: s.isna().sum(), axis=1)
computes the number of days the song was in the Top 200. As such, the
correct interpretation is that "pepas" was in the
Top 200 for 23 days in May.
The average score on this problem was 68%.
In defining pivoted, we set the keyword argument
aggfunc to np.max. Which of the following
functions could we have used instead of np.max without
changing the values in pivoted? Select all that
apply.
np.mean
np.median
len
lambda df: df.iloc[0]
None of the above
Answer: Option A, B and D
For each combination of "track_name" and
"date", there is just a single value — the number of
streams that song received on that date. As such, the
aggfunc needs to take in a Series containing a single
number and return that same number.
The mean and median of a Series containing a single number is equal to that number, so the first two options are correct.
The length of a Series containing a single number is 1, no matter what that number is, so the third option is not correct.
lambda df: df.iloc[0] takes in a Series and returns
the first element in the Series, which is the only element in the
Series. This option is correct as well. (The parameter name
df is irrelevant.)
The average score on this problem was 80%.
Below, we define another DataFrame another_mystery.
another_mystery = (streams.groupby("date").last()
                            .groupby(["artist_names", "track_name"])
                            .count().reset_index())
another_mystery has 5 rows. In one sentence, describe
the significance of the number 5 in the context of the
streams dataset. For instance, a correctly formatted but
incorrect answer is “There are 5 unique artists in
streams." Your answer should not include the word”row".
Answer: See below.
1in Since streams is sorted by "date" in
descending order and, within each "date", by
"streams" in ascending order,
streams.groupby("date").last() is a DataFrame containing
the song with the most "streams" on each day in May. In
other words, we found the “top song" for each day. (The DataFrame we
created has 31 rows.)
When we then execute
.groupby(["artist_names", "track_name"]).count(), we create
one row for every unique combination of song and artist, amongst the
“top songs". (If no two artists have a song with the same name, this is
the same as creating one row for every unique song.) Since there are 5
rows in this new DataFrame (resetting the index doesn’t do anything
here), it means that there were only 5 unique songs that were
ever the “top song" in a day in May; this is the correct
interpretation.
The average score on this problem was 50%.
Suppose the DataFrame today consists of 15 rows — 3 rows
for each of 5 different "artist_names". For each artist, it
contains the "track_name" for their three most-streamed
songs today. For instance, there may be one row for
"olivia rodrigo" and "favorite crime", one row
for "olivia rodrigo" and "drivers license",
and one row for "olivia rodrigo" and
"deja vu".
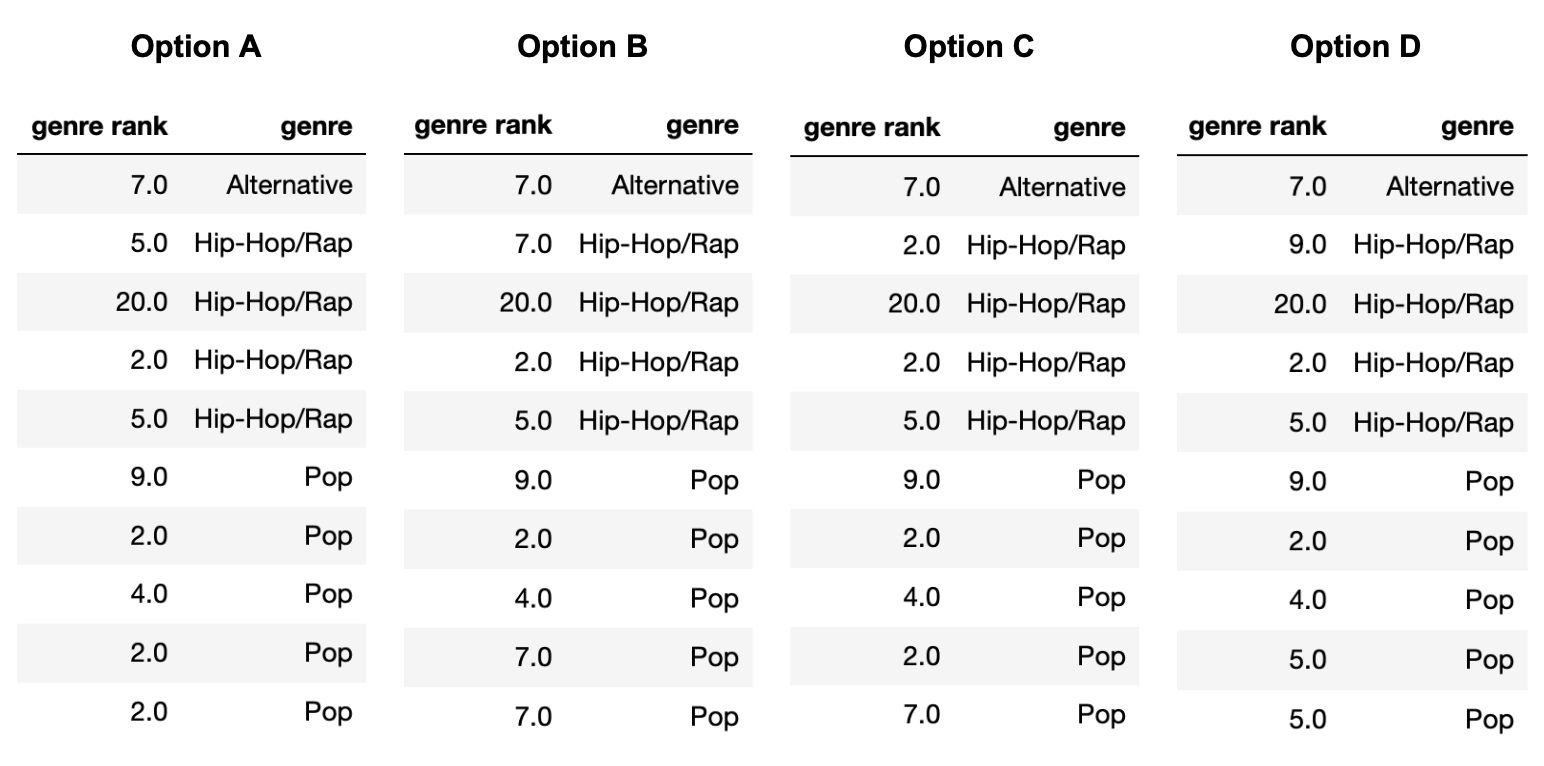
Another DataFrame, genres, is shown below in its
entirety.
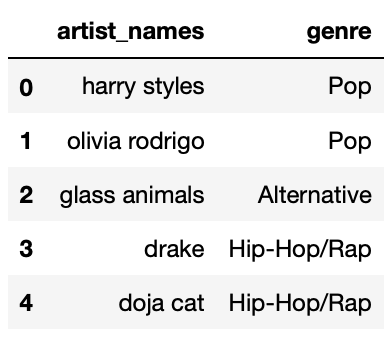
Suppose we perform an inner merge between
today and genres on
"artist_names". If the five "artist_names" in
today are the same as the five "artist_names"
in genres, what fraction of the rows in the merged
DataFrame will contain "Pop" in the "genre"
column? Give your answer as a simplified fraction.
Answer: \frac{2}{5}
If the five "artist_names" in today and
genres are the same, the DataFrame that results from an
inner merge will have 15 rows, one for each row in today.
This is because there are 3 matches for "harry styles", 3
matches for "olivia rodrigo", 3 matches for
"glass animals", and so on.
In the merged DataFrame’s 15 rows, 6 of them will correspond to
"Pop" artists — 3 to "harry styles" and 3 to
"olivia rodrigo". Thus, the fraction of rows that contain
"Pop" in the "genre" column is \frac{6}{15} = \frac{2}{5} (which is the
fraction of rows that contained "Pop" in
genres["genre"], too).
The average score on this problem was 97%.
Suppose we perform an inner merge between
today and genres on
"artist_names". Furthermore, suppose that the only
overlapping "artist_names" between today and
genres are "drake" and
"olivia rodrigo". What fraction of the rows in the merged
DataFrame will contain "Pop" in the "genre"
column? Give your answer as a simplified fraction.
Answer: \frac{1}{2}
If we perform an inner merge, there will only be 6 rows in the merged
DataFrame — 3 for "olivia rodrigo" and 3 for
"drake". 3 of those 6 rows will have "Pop" in
the "genre" column, hence the answer is \frac{3}{6} = \frac{1}{2}.
The average score on this problem was 86%.
Suppose we perform an outer merge between
today and genres on
"artist_names". Furthermore, suppose that the only
overlapping "artist_names" between today and
genres are "drake" and
"olivia rodrigo". What fraction of the rows in the merged
DataFrame will contain "Pop" in the "genre"
column? Give your answer as a simplified fraction.
Answer: \frac{2}{9}
Since we are performing an outer merge, we can decompose the rows in the merged DataFrame into three groups:
Rows that are in today that are not in
genres. There are 9 of these (3 each for the 3 artists that
are in today and not genres).
today doesn’t have a "genre" column, and so
all of these "genre"s will be NaN upon
merging.
Rows that are in genres that are not in
today. There are 3 of these — one for
"harry styles", one for "glass animals", and
one for "doja cat". 1 of these 3 have "Pop" in
the "genre" column.
Rows that are in both today and genres.
There are 6 of these — 3 for "olivia rodrigo" and 3 for
"drake" — and 3 of those rows contain "Pop" in
the "genre" column.
Tallying things up, we see that there are 9
+ 3 + 6 = 18 rows in the merged DataFrame overall, of which 0 + 1 + 3 = 4 have "Pop" in the
"genre" column. Hence, the relevant fraction is \frac{4}{18} = \frac{2}{9}.
The average score on this problem was 29%.
Billy and Daisy each decide what songs to stream by rolling dice. Billy rolls a six-sided die 36 times and sees the same number of 1s, 2s, 3s, 4s, 5s, and 6s. Daisy rolls a six-sided die 72 times and sees 36 1s, 18 4s, and 18 6s.
What is the total variation distance (TVD) between their distributions of rolls? Give your answer as a number.
Answer: \frac{1}{2}
First, we must normalize their distributions so they sum to 1. \text{billy} = \begin{bmatrix} \frac{1}{6}, \frac{1}{6}, \frac{1}{6}, \frac{1}{6}, \frac{1}{6}, \frac{1}{6} \end{bmatrix}, \: \: \: \text{daisy} = \begin{bmatrix} \frac{1}{2}, 0, 0, \frac{1}{4}, 0, \frac{1}{4} \end{bmatrix}
Then, recall that the TVD is the sum of the absolute differences in proportions, all divided by 2:
\begin{aligned} \text{TVD} &= \frac{1}{2} \Bigg( \Big| \frac{1}{2} - \frac{1}{6} \Big| + \Big| 0 - \frac{1}{6} \Big| + \Big| 0 - \frac{1}{6} \Big| + \Big| \frac{1}{4} - \frac{1}{6} \Big| + \Big| 0 - \frac{1}{6} \Big| + \Big| \frac{1}{4} - \frac{1}{6} \Big| \Bigg) \\ &= \frac{1}{2} \Bigg( \frac{2}{6} + \frac{1}{6} + \frac{1}{6} + \frac{1}{12} + \frac{1}{6} + \frac{1}{12} \Bigg) \\ &= \frac{1}{2} \cdot 1 \\ &= \frac{1}{2}\end{aligned}
The average score on this problem was 42%.
Consider two categorical distributions, each made up of the same n categories. Given no other information, what is the smallest possible TVD between the two distributions, and what is the largest possible TVD between the two distributions? Give both answers as numbers.
smallest possible TVD =
largest possible TVD =
Answer: Smallest: 0, Largest: 1
There is an absolute value in the definition of TVD, so it must be at least 0. The TVD does not scale with the number of categories; its maximum possible value is 1. We will not provide a rigorous proof here, but intuitively, the most “different" two distributions can be is if they both have 100% of their values in different categories. In such a case, the TVD is 1.
The average score on this problem was 74%.
Consider the following pair of distributions.
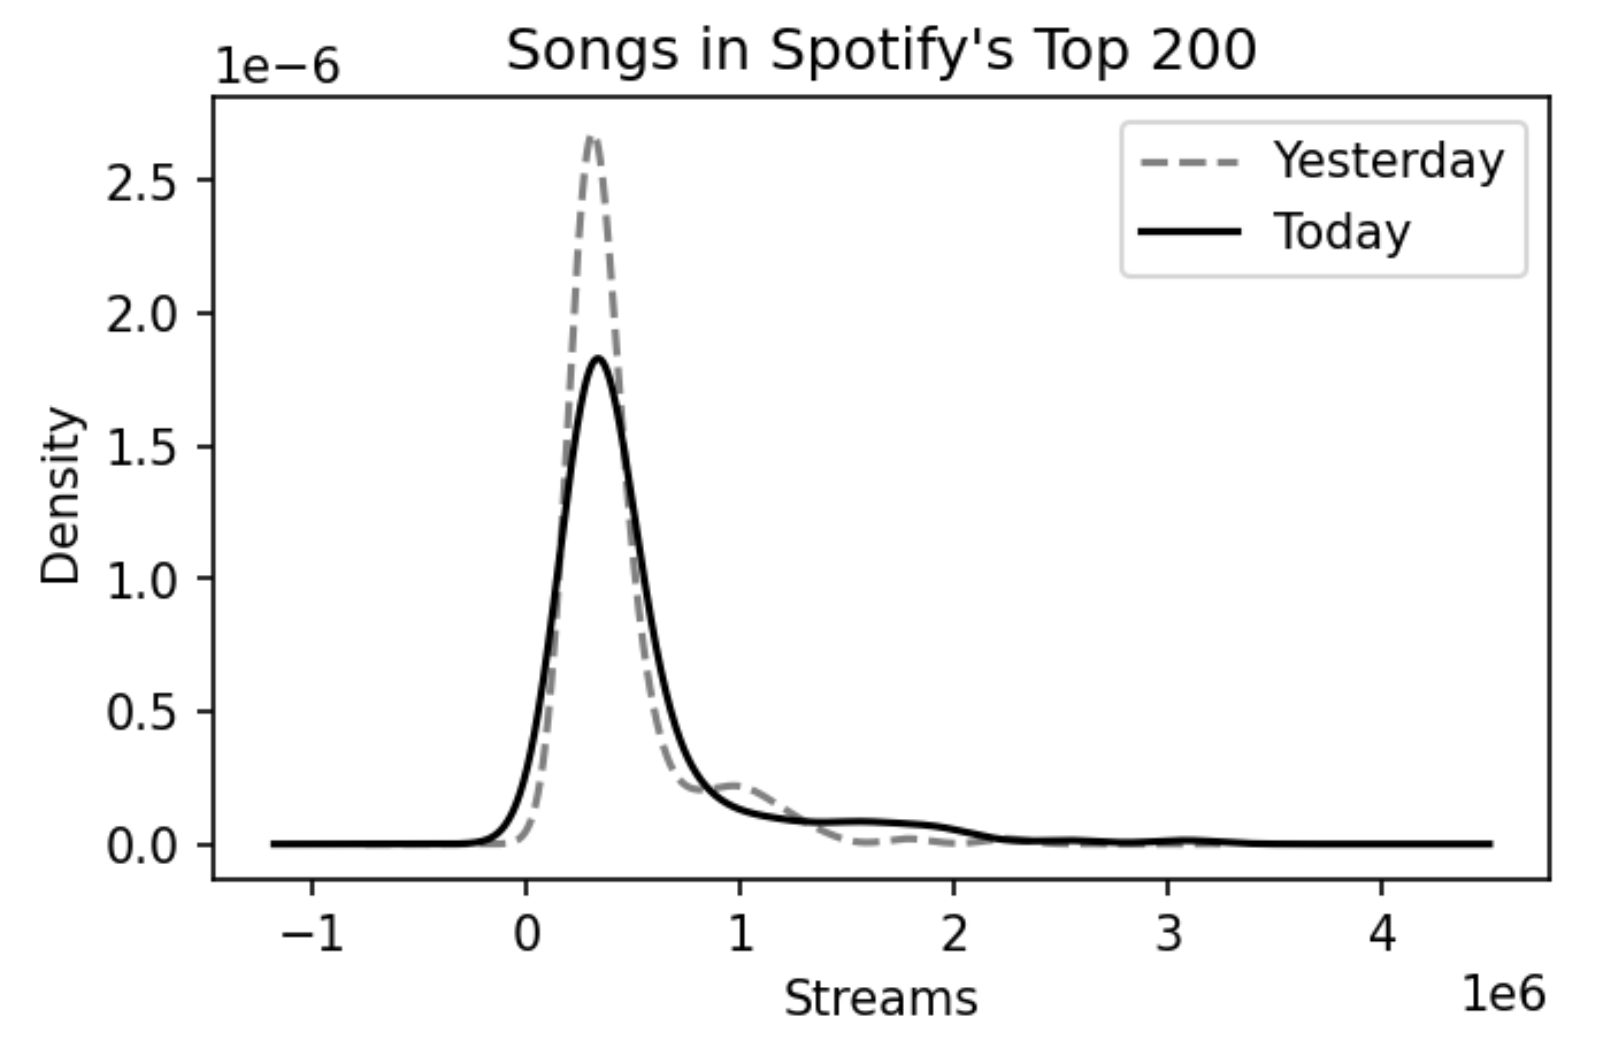
Suppose we want to perform a permutation test to test whether the two distributions come from the same population distribution. Which test statistic is most likely to yield a significant result?
Difference in means
Absolute difference in means
Kolmogorov-Smirnov (K-S) statistic
Total variation distance
Answer: Option C
These are two quantitative distributions, and the total variation distance only applies for categorical distributions.
These two distributions have similar means, so the difference in means and absolute difference in means won’t be able to tell them apart.
As such, the correct answer is the Kolmogorov-Smirnov statistic, which roughly measures the largest “gap" between two cumulative distribution functions.
The average score on this problem was 87%.
As a music enthusiast who checks Spotify’s Top 200 daily, you have noticed that many more songs from the “Hip-Hop/Rap" genre were popular in 2021 than were popular in years prior. You decide to investigate whether this could have happened by chance, or if Hip-Hop/Rap is actually becoming more popular.
You acquire ten DataFrames, one for each year between 2012 and 2021
(inclusive), containing the Top 200 songs on each day of each year. Each
DataFrame has four columns, "year",
"artist_names", "track_name", and
"genre", and 365 \cdot 200 =
73000 rows (or, in the case of leap years 2012 and 2016, 366 \cdot 200 = 73200 rows). You concatenate
these DataFrames into a big DataFrame called all_years.
To conduct a hypothesis test, you assume that all of the songs that
were ever in the Top 200 in a particular year are a sample of all
popular songs from that year. As such, all_years contains a
sample of all popular songs from 2012-2021. Your hypotheses are as
follows:
Null Hypothesis: The number of unique Hip-Hop/Rap songs that were popular in 2021 is equal to the average number of unique Hip-Hop/Rap songs that were popular each year between 2012 and 2021 (inclusive).
Alternative Hypothesis: The number of unique Hip-Hop/Rap songs that were popular in 2021 is greater than the average number of unique Hip-Hop/Rap songs that were popular each year between 2012 and 2021 (inclusive).
To generate data under the null, you decide to treat the songs that were in the Top 200 in 2021 as a random sample from the songs that were in the Top 200 in all ten years. As your test statistic, you use the number of unique Hip-Hop/Rap songs in your sample.
Complete the implementation of the hypothesis test given on the next page.
Note: Remember that songs can appear multiple times
in all_years — many songs appear in the Top 200 multiple
times in the same year, and some even appear in the Top 200 in different
years. However, for the purposes of this question, you can assume that
no two different "artist_names" have songs with the same
"track_name"; that is, each "track_name"
belongs to a unique "artist_names".
all_years = # DataFrame that contains all 10 years' charts

# Helper function to compute the number of
# unique Hip-Hop/Rap songs in a given DataFrame
def unique_rap(df):
    rap_only = df[df["genre"] == "Hip-Hop/Rap"]
    return rap_only.groupby(__(a)__).count()__(b)__[0]

count_2021 = unique_rap(all_years[all_years["year"] == 2021])
counts = np.array([])

for _ in range(10000):
    samp = all_years.sample(__(c)__, replace=True)
    counts = np.append(counts, unique_rap(samp))

p_val = (__(d)__).mean()What goes in blank (a)?
"year"
"artist_names"
"track_name"
"genre"
Answer: Option C: "track_name"
The first thing to notice is that first line in the function filters
for all the rap songs in df. Next, since the helper function is supposed
to return the number of unique Hip-Hop/Rap songs in a given DataFrame,
we group by "track_name" so that each group/category is a
unique song. Grouping by "year",
"artist_names", or "genre" won’t help us
compute the number of unique songs.
The average score on this problem was 89%.
What goes in blank (b)?
.shape
.loc
.iloc
Nothing (i.e. add [0] immediately after
.count())
Answer: Option A: .shape
Note that after grouping by "track_name", each
individual row in the resulting dataframe is a unique song within the
rap genre. Thus the number of rows in the resulting dataframe is just
the number of unique rap songs in a dataframe. To get the number of rows
of a dataframe, we simply do .shape[0]
The average score on this problem was 89%.
What goes in blank (c)?
count_2021.shape[0]
200
365
200 * 365
Answer: Option D: 200 * 365
Consider the following statement from the problem: “To generate data
under the null, you decide to treat the songs that were in the Top 200
in 2021 as a random sample from the songs that were in the Top 200 in
all ten years.” Thus it follows that we need to generate
200 * 365 songs since there are 200 * 365
songs in the Top 200 in 2021.
Alternatively, it makes sense to sample 200 * 365 songs
from all_years because we use the number of unique rap
songs as a test statistic for each sample. Thus our sample should be the
same size as the number of songs in the Top 200 in 2021.
The average score on this problem was 52%.
What goes in blank (d)?
Answer: (counts >= count_2021)
Note that counts is an array that contains the number of
Hip-Hop/Rap songs from each sample. Because our alternative hypothesis
is that “The number of unique Hip-Hop/Rap songs that were popular in
2021 is greater than the average number of unique Hip-Hop/Rap
songs that were popular each year between 2012 and 2021”, we’re
interested in the proportion of simulated test statistics that were
equal to our observed or greater.
counts >= count_2021 is an array of Booleans, denoting
whether or not count_2021 was greater than the number of
rap songs in each sample, and
(counts >= count_2021).mean() is the proportion
(p-value) we’re looking for.
The average score on this problem was 53%.
The DataFrame random_10 contains the
"track_name" and "genre" of 10 randomly-chosen
songs in Spotify’s Top 200 today, along with their
"genre_rank", which is their rank in the Top 200
among songs in their "genre". For
instance, “the real slim shady" is the 20th-ranked Hip-Hop/Rap song in
the Top 200 today. random_10 is shown below in its
entirety.
The "genre_rank" column of random_10
contains missing values. Below, we provide four different imputed
"genre_rank" columns, each of which was created using a
different imputation technique. On the next page, match each of the four
options to the imputation technique that was used in the option.
Note that each option (A, B, C, D) should be used exactly once between parts (a) and (d).
In which option was unconditional mean imputation used?
Answer: Option B
Explanation given in part d) below
The average score on this problem was 99%.
In which option was mean imputation conditional on
"genre" used?
Answer: Option D
Explanation given in part d) below
The average score on this problem was 96%.
In which option was unconditional probabilistic imputation used?
Answer: Option C
Explanation given in part d) below
The average score on this problem was 92%.
In which option was probabilistic imputation conditional on
"genre" used?
Answer: Option A
First, note that in Option B, all three missing values are filled
in with the same number, 7. The mean of the observed values in
random_10["genre rank"] is 7, so we must have performed
unconditional mean imputation in Option B. (Technically, it’s possible
for Option B to be the result of unconditional probabilistic imputation,
but we stated that each option could only be used once, and there is
another option that can only be unconditional probabilistic
imputation.)
Then note that in Option C, the very last missing value (in the
"Pop" "genre") is filled in with a 7, which is
not the mean of the observed "Pop" values, but rather a
value from the "Alternative" "genre". This
must mean that unconditional probabilistic imputation was used in Option
C, since that’s the only way a value from a different group can be used
for imputation (if we are not performing some sort of mean
imputation).
This leaves Option A and Option D. The last two missing values
(the two in the "Pop" "genre") are both filled
in with the same value, 2 in Option A and 5 in Option D. The mean of the
observed values for the "Pop" "genre" is \frac{9+2+4}{3} = 5, so mean imputation
conditional on "genre" must have been used in Option D and
thus probabilistic imputation conditional on "genre" must
have been used in Option A.
The average score on this problem was 92%.
In parts (e) and (f), suppose we want to run a permutation test to
determine whether the missingness of "genre rank" depends
on "genre".
Name a valid test statistic for this permutation test.
Answer: Total Variation Distance (TVD)
We are comparing two distributions:
The distribution of "genre" when
"genre rank" is missing.
The distribution of "genre" when
"genre rank" is not missing.
Since the distribution of "genre" is categorical, the
above two distributions are also categorical. The only test statistic we
have for comparing categorical distributions is the total variation
distance (TVD).
The average score on this problem was 63%.
Suppose we conclude that the missingness of "genre rank"
likely depends on "genre". Which
imputation technique should we choose if we want to preserve the
variance of the "genre rank" column?
Unconditional mean imputation
Mean imputation conditional on "genre"
Unconditional probabilistic imputation
Probabilistic imputation conditional on "genre"
Answer: Option D: Probabilistic imputation
conditional on "genre"
Mean imputation does not preserve the variance of the imputed values
— since it fills in all missing numbers with the same number (either
overall, or within each group), the variance of the imputed dataset is
less than the pre-imputed dataset. To preserve the variance of the
imputed values, we must use probabilistic imputation of some sort. Since
the missingness of "genre rank" was found to be dependent
on "genre", we perform probabilistic imputation
conditional on "genre", i.e. impute
"genre rank"s randomly within each
"genre".
The average score on this problem was 75%.
The DataFrame trends contains the the number of streams
yesterday ("yest") and the number of streams the day before
yesterday ("day_before_yest") for songs in Spotify’s Top
200. Remember, a song was in the Top 200 yesterday if it was one of the
200 most streamed songs yesterday.
The first few rows of trends are shown below.
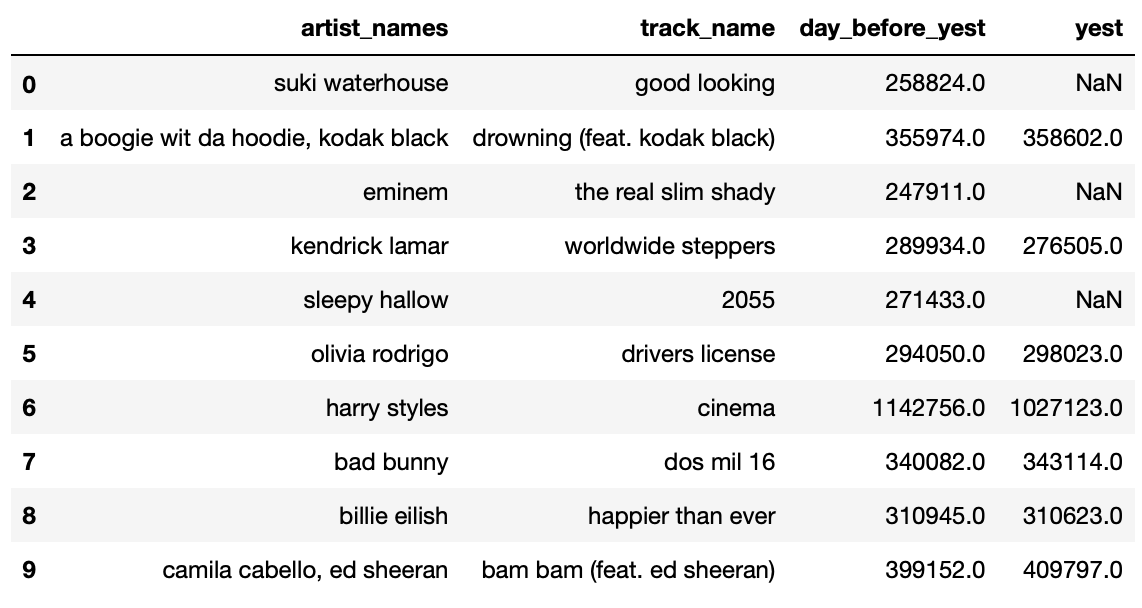
The "yest" column contains missing values. What is the
most likely missingness mechanism for "yest"?
Missing by design
Not missing at random
Missing at random
Missing completely at random
Answer: Option B: NMAR or Option C: MAR
We accepted two answers here — not missing at random and missing at random.
MCAR is ruled out right away, since there is some “pattern" to
the missingness, i.e. some sort of relationship between
"day_before_yest" and the missingness of
"yest".
One could argue not missing at random, because stream counts are
more likely to be missing from "yest" if they are smaller.
A song is missing from "yest" but present in
"day_before_yest" if its number of streams was in the Top
200 yesterday but not today; if this is true, this must mean that its
number of streams is less than any of the songs whose stream counts are
actually in "yest".
One could also argue missing at random, because the missingness
of "yest" does indeed depend on
"day_before_yest".
Missing by design is not a valid answer here.
While it is true that "day_before_yest" tells you something
about the missingness of "yest", it is not
the case that you can 100% of the time predict if "yest"
will be missing just by looking at "day_before_yest"; this
would need to be the case if "yest" were missing by
design.
The average score on this problem was 64%.
Consider the following HTML document, which represents a webpage containing the top few songs with the most streams on Spotify today in Canada.
<head>
    <title>3*Canada-2022-06-04</title>
<head>
<body>
    <h1>Spotify Top 3 - Canada</h1>
    <table>
        <tr class='heading'>
            <th>Rank</th>
            <th>Artist(s)</th>
            <th>Song</th>
        </tr>
        <tr class=1>
            <td>1</td>
            <td>Harry Styles</td>
            <td>As It Was</td>
        </tr>
        <tr class=2>
            <td>2</td>
            <td>Jack Harlow</td>
            <td>First Class</td>
        </tr>
        <tr class=3>
            <td>3</td>
            <td>Kendrick Lamar</td>
            <td>N95</td>
        </tr>
    </table>
</body>
Suppose we define soup to be a
BeautifulSoup object that is instantiated using the
document above.
How many leaf nodes are there in the DOM tree of the previous document — that is, how many nodes have no children?
Answer: 14
There’s 1 <title>, 1 <h1>, 3
<th>s, and 9 <td>s, adding up to
14.
The average score on this problem was 64%.
What does the following line of code evaluate to?
len(soup.find_all("td"))Answer: 9
As mentioned in the solution to the part above, there are 9
<td> nodes, and soup.find_all finds them
all.
The average score on this problem was 95%.
What does the following line of code evaluate to?
soup.find("tr").get("class")Answer: ["heading"] or
"heading"
soup.find("tr") finds the first occurrence of a
<tr> node, and get("class") accesses the
value of its "class" attribute.
Note that technically the answer is ["heading"], but
"heading" received full credit too.
The average score on this problem was 96%.
Complete the implementation of the function top_nth,
which takes in a positive integer n and returns the
name of the n-th ranked
song in the HTML document. For instance,
top_nth(2) should evaluate to "First Class"
(n=1 corresponds to the top song).
Note: Your implementation should work in the case that the page contains more than 3 songs.
def top_nth(n):
    return soup.find("tr", attrs=__(a)__).find_all("td")__(b)__
What goes in blank (a)?
What goes in blank (b)?
Answer: a) {'class' : n} b)
[2].text or [-1].text
The logic is to find the <tr> node with the
correct class attribute (which we do by setting attr to
{'class' : 2}), then access the text of the node’s last
<td> child (since that’s where the song titles are
stored).
The average score on this problem was 66%.
Suppose we run the line of code r = requests.get(url),
where url is a string containing a URL to some online data
source.
True or False: If r.status_code is
200, then r.text must be a string containing
the HTML source code of the site at url.
True
False
Answer: Option B: False
A status code of 200 means that the request has succeeded. Hence, the response could be JSON, it is not necessarily HTML.
The average score on this problem was 44%.
Each Spotify charts webpage is specific to a particular country (as different countries have different music tastes). Embedded in each charts page is a “datestring", that describes:
the number of songs on the page,
the country, and
the date.
For instance, "3*Canada-2022-06-04" is a datestring
stating that the page contains the top 3 songs in Canada on June 4th,
2022. A valid datestring contains a number, a country name, a year, a
month, and a day, such that:
the number, country name, and year are each separated by a single
dash ("-"), asterisk ("*"), or space
(" ").
the year, month, and day are each separated by a single dash
("-") only
Below, assign exp to a regular expression that
extracts country names from valid datestrings. If the
datestring does not follow the above format, it should not extract
anything. Example behavior is given below.
>>> re.findall(exp, "3*Canada-2022-06-04")
["Canada"]

>>> re.findall(exp, "144 Brazil*1998-11-26")
["Brazil"]

>>> re.findall(exp, "18_USA-2009-05-16")
[]
exp = r"^ $"
Answer: One solution is given below.
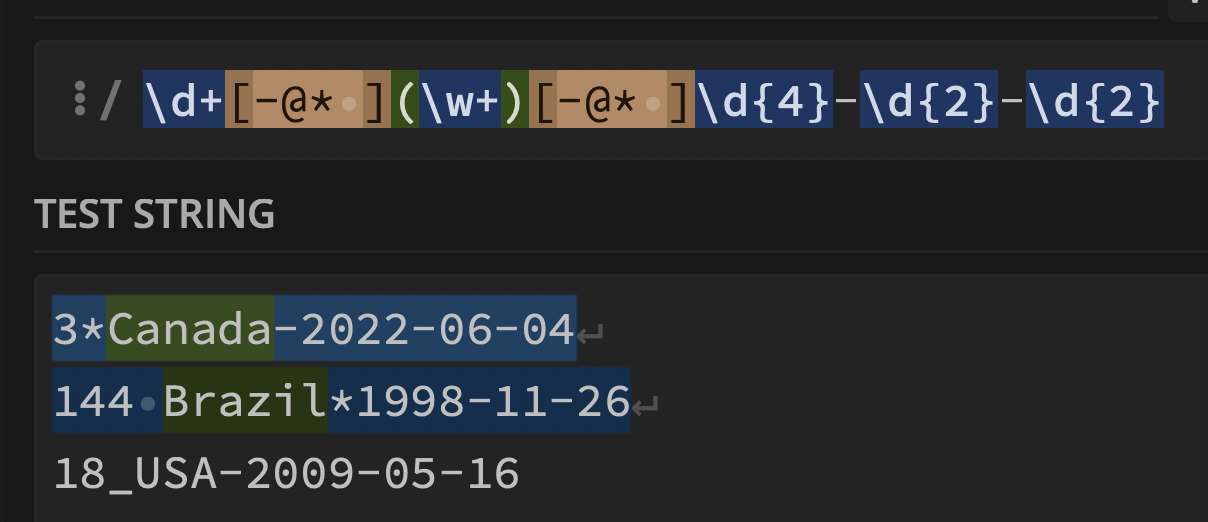
Click this link to interact with the solution on regex101.
While grading, we were not particular about students’ treatment of uppercase characters in country names.
The average score on this problem was 76%.
Consider the following regular expression.
r"^\w{2,5}.\d*\/[^A-Z5]{1,}"Select all strings below that contain any match with the regular expression above.
"billy4/Za"
"billy4/za"
"DAI_s2154/pacific"
"daisy/ZZZZZ"
"bi_/_lly98"
"!@__!14/atlantic"
Answer: Option B, Option C, and Option E
Let’s first dissect the regular expression into manageable groups:
"^" matches the regex to its right at the start of a
given string"\w{2,5}" matches alphanumeric characters (a-Z, 0-9 and
_) 2 to 5 times inclusively. (Note the that it does indeed match with
the underscore)"." is a basic wildcard"\d*" matches digits (0-9), at least 0 times"\/" matches the "/" character"[^A-Z5]{1,}" matches any character that isn’t (A-Z or
5) at least once.Thus using these rules, it’s not hard to verify that Options B, C and E are matches.
The average score on this problem was 85%.
Consider the following string and regular expressions:
song_str = "doja cat you right"

exp_1 = r"\b\w+\b" # \b stands for word boundary
exp_2 = r" \w+"
exp_3 = r" \w+ "
What does len(re.findall(exp_1, song_str)) evaluate
to?
What does len(re.findall(exp_2, song_str)) evaluate
to?
What does len(re.findall(exp_3, song_str)) evaluate
to?
Answer: See below
"\b" matches “word boundaries", which are any
locations that separate words. As such, there are 4 matches —
["doja", "cat", "you", "right"]. Thus the answer is
4.
The 3 matches are [" cat", " you", " right"]. Thus
the answer is 3.
This was quite tricky! The key is remembering that
re.findall only finds non-overlapping
matches (if you look at the solutions to the above two parts,
none of the matches overlapped). Reading from left to right, there is
only a single non-overlapping match: "cat". Sure,
" you " also matches the pattern, but since the space after
"cat" was already “found" by re.findall, it
cannot be included in any future matches. Thus the answer is 1.
The average score on this problem was 60%.
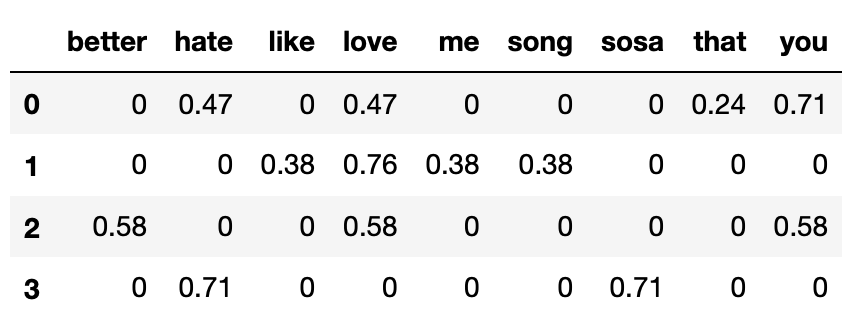
The DataFrame below contains a corpus of four song titles, labeled from 0 to 3.
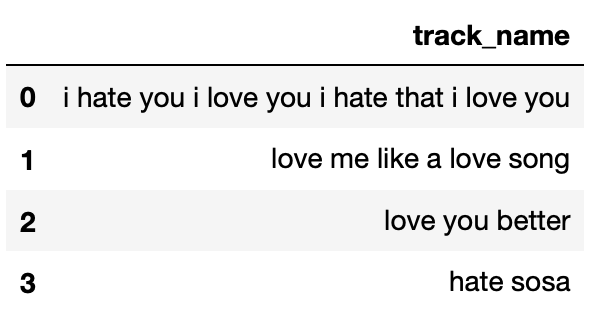
What is the TF-IDF of the word "hate" in Song 0’s title?
Use base 2 in your logarithm, and give your answer as a simplified
fraction.
Answer: \frac{1}{6}
There are 12 words in Song 0’s title, and 2 of them are
"hate", so the term frequency of "hate" in
Song 0’s title is \frac{2}{12} =
\frac{1}{6}.
There are 4 documents total, and 2 of them contain
"hate" (Song 0’s title and Song 3’s title), so the inverse
document frequency of "hate" in the corpus is \log_2 \left( \frac{4}{2} \right) = \log_2 (2) =
1.
Then, the TF-IDF of "hate" in Song 0’s title is
\text{TF-IDF} = \frac{1}{6} \cdot 1 = \frac{1}{6}
The average score on this problem was 86%.
Which word in Song 0’s title has the highest TF-IDF?
"i"
"hate"
"you"
"love"
"that"
Two or more words are tied for the highest TF-IDF in Song 0’s title
Answer: Option A: "i"
It was not necessary to compute the TF-IDFs of all words in Song 0’s
title to determine the answer. \text{tfidf}(t,
d) is high when t occurs often
in d but rarely overall. That is the
case with "i" — it is the most common word in Song 0’s
title (with 4 appearances), but it does not appear in any other
document. As such, it must be the word with the highest TF-IDF in Song
0’s title.
The average score on this problem was 84%.
Let \text{tfidf}(t, d) be the TF-IDF of term t in document d, and let \text{bow}(t, d) be the number of occurrences of term t in document d.
Select all correct answers below.
If \text{tfidf}(t, d) = 0, then \text{bow}(t, d) = 0.
If \text{bow}(t, d) = 0, then \text{tfidf}(t, d) = 0.
Neither of the above statements are necessarily true.
Answer: Option B
Recall that \text{tfidf}(t, d) = \text{tf}(t, d) \cdot \text{idf}(t), and note that \text{tf}(t, d) is just $ (t, d) $. Thus, \text{tfidf}(t, d) is 0 is if either \text{bow}(t, d) = 0 or \text{idf}(t) = 0.
So, if \text{bow}(t, d) = 0, then \text{tf}(t, d) = 0 and \text{tfidf}(t, d) = 0, so the second option is true. However, if \text{tfidf}(t, d) = 0, it could be the case that \text{bow}(t, d) > 0 and \text{idf}(t) = 0 (which happens when term t is in every document), so the first option is not necessarily true.
The average score on this problem was 91%.
Below, we’ve encoded the corpus from the previous page using the bag-of-words model.
Note that in the above DataFrame, each row has been normalized to have a length of 1 (i.e. |\vec{v}| = 1 for all four row vectors).
Which song’s title has the highest cosine similarity with Song 0’s title?
Song 1
Song 2
Song 3
Answer: Option B: Song 2
Recall, the cosine similarity between two vectors \vec{a}, \vec{b} is computed as
\cos \theta = \frac{\vec{a} \cdot \vec{b}}{| \vec{a} | | \vec{b}|}
We are told that each row vector is already normalized to have a length of 1, so to compute the similarity between two songs’ titles, we can compute dot products directly.
Song 0 and Song 1: 0.47 \cdot 0.76
Song 0 and Song 2: 0.47 \cdot 0.58 + 0.71 \cdot 0.58
Song 0 and Song 3: 0.47 \cdot 0.71
Without using a calculator (which students did not have access to during the exam), it is clear that the dot product between Song 0’s title and Song 2’s title is the highest, hence Song 2’s title is the most similar to Song 0’s.
The average score on this problem was 87%.
Recall from Project 4, a trigram is an N-Gram with N=3. Below, we instantiate a trigram language model with a list of 12 tokens.
# \x02 means start of paragraph, \x03 means end of paragraph
tokens = ["\x02", "hi", "my", "name", "is", "what",
            "my", "name", "is", "who", "my", "\x03"]

lm = NGramLM(3, tokens)
What does lm.probability(("name", "is", "what", "my"))
evaluate to? In other words, what is P(\text{name is what my})? Show your
work in the box below, and give your final answer as a simplified
fraction in the box at the bottom of the page.
Hint: Do not perform any unnecessary computation — only compute the conditional probabilities that are needed to evaluate P(\text{name is what my}).
Answer: \frac{1}{12}
Since we are using a trigram model, to compute the conditional
probability of a token, we must condition on the prior two tokens. For
the first and second tokens, "name" and "is",
there aren’t two prior tokens to condition on, so we instead look at
unigrams and bigrams instead.
First, we decompose P(\text{name is what my}):
\begin{aligned} P(\text{name is what my}) &= P(\text{name}) \cdot P(\text{is $|$ name}) \cdot P(\text{what $|$ name is}) \cdot P(\text{my $|$ is what}) \end{aligned}
P(\text{name}) is \frac{2}{12}, since there are 12 total tokens
and 2 of them are equal to "name".
P(\text{is $|$ name}) is \frac{2}{2} = 1, because of the 2 times
"name" appears, "is" always follows
it.
P(\text{what $|$ name is}) is
\frac{1}{2}, because of the 2 times
"name is" appears, "what" follows it once
("who" follows it the other time).
P(\text{my $|$ is what}) is
\frac{1}{1} = 1, because
"is what" only appeared once, and "my"
appeared right after it.
Thus: \begin{aligned} P(\text{name is what my}) &= P(\text{name}) \cdot P(\text{is $|$ name}) \cdot P(\text{what $|$ name is}) \cdot P(\text{my $|$ is what}) \\ &= \frac{2}{12} \cdot 1 \cdot \frac{1}{2} \cdot 1 \\ &= \frac{1}{12} \end{aligned}
The average score on this problem was 57%.
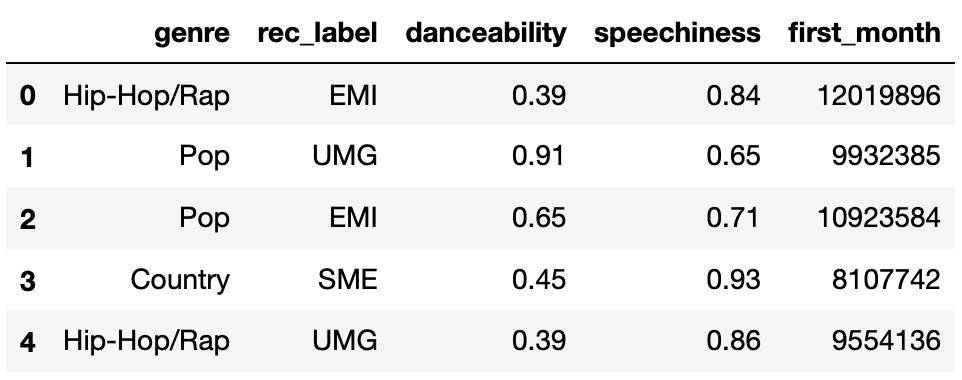
The DataFrame new_releases contains the following
information for songs that were recently released:
"genre": the genre of the song (one of the following
5 possibilities: "Hip-Hop/Rap", "Pop",
"Country", "Alternative", or
"International")
"rec_label": the record label of the artist who
released the song (one of the following 4 possibilities:
"EMI", "SME", "UMG", or
"WMG")
"danceability": how easy the song is to dance to,
according to the Spotify API (between 0 and 1)
"speechiness": what proportion of the song is made
up of spoken words, according to the Spotify API (between 0 and
1)
"first_month": the number of total streams the song
had on Spotify in the first month it was released
The first few rows of new_releases are shown below
(though new_releases has many more rows than are shown
below).
We decide to build a linear regression model that predicts
"first_month" given all other information. To start, we
conduct a train-test split, splitting new_releases into
X_train, X_test, y_train, and
y_test.
We then fit two linear models (with intercept terms) to the training data:
Model 1 (lr_one): Uses "danceability"
only.
Model 2 (lr_two): Uses "danceability"
and "speechiness" only.
True or False: If
lr_one.score(X_train, y_train) is much lower than
lr_one.score(X_test, y_test), it is likely that
lr_one overfit to the training data.
True
False
Answer: False
For regression models, the score method computes R^2. A higher R^2 indicates a better linear fit. If the
training R^2 is much greater than the
testing R^2, that is indication of
overfitting. However, that is not the case here — here, we were asked
what happens if the training R^2 is
much less than the testing R^2, which
is not indication of overfitting (it is an indication that your model,
luckily, performs much better on unseen data than it does on observed
data!).
The average score on this problem was 81%.
Consider the following outputs.
>>> X_train.shape[0]
50

>>> np.sum((y_train - lr_two.predict(X_train)) ** 2)
500000 # five hundred thousand
What is Model 2 (lr_two)’s training RMSE? Give your
answer as an integer.
Answer: 100
We are given that there are n=50 data points, and that the sum of squared errors \sum_{i = 1}^n (y_i - H(x_i))^2 is 500{,}000. Then:
\begin{aligned} \text{RMSE} &= \sqrt{\frac{1}{n} \sum_{i = 1}^n (y_i - H(x_i))^2} \\ &= \sqrt{\frac{1}{50} \cdot 500{,}000} \\ &= \sqrt{10{,}000} \\ &= 100\end{aligned}
The average score on this problem was 87%.
Now, suppose we fit two more linear models (with intercept terms) to the training data:
Model 3 (\texttt{lr\_drop}):
Uses "danceability" and "speechiness" as-is,
and one-hot encodes "genre" and "rec_label",
using OneHotEncoder(drop="first").
Model 4 (\texttt{lr\_no\_drop}):
Uses "danceability" and "speechiness" as-is,
and one-hot encodes "genre" and "rec_label",
using OneHotEncoder().
Note that the only difference between Model 3 and Model 4 is the fact
that Model 3 uses drop="first".
How many one-hot encoded columns are used in each model? In other words, how many binary columns are used in each model? Give both answers as integers.
Hint: Make sure to look closely at the description of
new_releases at the top of the previous page, and don’t
include the already-quantitative features.
number of one-hot encoded columns in Model 3 (lr_drop)
=
number of one-hot encoded columns in Model 4
(lr_no_drop) =
Answer: 7 and 9
There are 5 unique values of "genre" and 4 unique values
of "rec_label", so if we create a single one-hot encoded
column for each one, there would be 5 + 4 =
9 one-hot encoded columns (which there are in
lr_no_drop).
If we drop one one-hot-encoded column per category, which is what
drop="first" does, then we only have (5 - 1) + (4 - 1) = 7 one-hot encoded columns
(which there are in lr_drop).
The average score on this problem was 75%.
Fill in the blank:
lr_drop.score(X_test, y_test) is _____
lr_no_drop.score(X_test, y_test).
likely greater than
roughly equal to
likely less than
Answer: Option B: roughly equal to
Multicollinearity does not impact a linear model’s ability to make predictions (even on unseen data), it only impacts the interpretability of its coefficients. As such, the testing RMSE of both Model 3 and Model 4 will be roughly the same.
The average score on this problem was 70%.
Recall, in Model 4 (lr_no_drop) we one-hot encoded
"genre" and "rec_label", and did not use
drop="first" when instantiating our
OneHotEncoder.
Suppose we are given the following coefficients in Model 4:
The coefficient on "genre_Pop" is 2000.
The coefficient on "genre_Country" is 1000.
The coefficient on "danceability" is 10^6 = 1{,}000{,}000.
Daisy and Billy are two artists signed to the same
"rec_label" who each just released a new song with the same
"speechiness". Daisy is a "Pop" artist while
Billy is a "Country" artist.
Model 4 predicted that Daisy’s song and Billy’s song will have the
same "first_month" streams. What is the absolute
difference between Daisy’s song’s "danceability"
and Billy’s song’s "danceability"? Give your answer as a
simplified fraction.
Answer: \frac{1}{1000}
“My favorite problem on the exam!" -Suraj
Model 4 is made up of 11 features, i.e. 11 columns.
4 of the columns correspond to the different values of
"rec_label". Since Daisy and Billy have the same
"rec_label", their values in these four columns are all the
same.
One of the columns corresponds to "speechiness".
Since Daisy’s song and Billy’s song have the same
"speechiness", their values in this column are the
same.
5 of the columns correspond to the different values of
"genre". Daisy is a "Pop" artist, so she has a
1 in the "genre_Pop" column and a 0 in the other four
"genre_" columns, and similarly Billy has a 1 in the
"genre_Country" column and 0s in the others.
One of the columns corresponds to "danceability",
and Daisy and Billy have different quantitative values in this
column.
Let d_1 and d_2.
The key is in recognizing that all features in Daisy’s prediction and
Billy’s prediction are the same, other than the coefficients on
"genre_Pop", "genre_Country", and
"danceability". Let’s let d_1 be Daisy’s song’s
"danceability", and let d_2 be Billy’s song’s
"danceability". Then:
\begin{aligned} 2000 + 10^{6} \cdot d_1 = 1000 + 10^{6} \cdot d_2 \\ 1000 &= 10^{6} (d_2 - d_1) \\ \frac{1}{1000} &= d_2 - d_1\end{aligned}
Thus, the absolute difference between their songs’
"danceability"s is \frac{1}{1000}.
The average score on this problem was 70%.
Suppose we build a binary classifier that uses a song’s
"track_name" and "artist_names" to predict
whether its genre is "Hip-Hop/Rap" (1) or not (0).
For our classifier, we decide to use a brand-new model built into
sklearn called the
BillyClassifier. A BillyClassifier instance
has three hyperparameters that we’d like to tune. Below, we show a
dictionary containing the values for each hyperparameter that we’d like
to try:
hyp_grid = {
  "radius": [0.1, 1, 2, 3, 4, 5, 6, 7, 8, 9, 10, 100], # 12 total
  "inflection": [-5, -4, -3, -2, -1, 0, 1, 2, 3, 4], # 10 total
  "color": ["red", "yellow", "green", "blue", "purple"] # 5 total
}
To find the best combination of hyperparameters for our
BillyClassifier, we first conduct a train-test split, which
we use to create a training set with 800 rows. We then use
GridSearchCV to conduct k-fold cross-validation for each combination
of hyperparameters in hyp_grid, with k=4.
When we call GridSearchCV, how many times is a
BillyClassifier instance trained in total? Give your answer
as an integer.
Answer: 2400
There are 12 \cdot 10 \cdot 5 = 600
combinations of hyperparameters. For each combination of
hyperparameters, we will train a BillyClassifier with that
combination of hyperparameters k = 4
times. So, the total number of BillyClassifier instances
that will be trained is 600 \cdot 4 =
2400.
The average score on this problem was 73%.
In each of the 4 folds of the data, how large is the training set, and how large is the validation set? Give your answers as integers.
size of training set =
size of validation set =
Answer: 600, 200
Since we performed k=4 cross-validation, we must divide the training set into four disjoint groups each of the same size. \frac{800}{4} = 200, so each group is of size 200. Each time we perform cross validation, one group is used for validation, and the other three are used for training, so the validation set size is 200 and the training set size is 200 \cdot 3 = 600.
The average score on this problem was 77%.
Suppose that after fitting a GridSearchCV instance, its
best_params_ attribute is
{"radius": 8, "inflection": 4, "color": "blue"}Select all true statements below.
The specific combination of hyperparameters in
best_params_ had the highest average training accuracy
among all combinations of hyperparameters in hyp_grid.
The specific combination of hyperparameters in
best_params_ had the highest average validation accuracy
among all combinations of hyperparameters in hyp_grid.
The specific combination of hyperparameters in
best_params_ had the highest training accuracy among all
combinations of hyperparameters in hyp_grid, in each of the
4 folds of the training data.
The specific combination of hyperparameters in
best_params_ had the highest validation accuracy among all
combinations of hyperparameters in hyp_grid, in each of the
4 folds of the training data.
A BillyClassifier that is fit using the specific
combination of hyperparameters in best_params_ is
guaranteed to have the best accuracy on unseen testing data among all
combinations of hyperparameters in hyp_grid.
Answer: Option B
When performing cross validation, we select the combination of
hyperparameters that had the highest average validation
accuracy across all four folds of the data. That is, by
definition, how best_params_ came to be. None of the other
options are guaranteed to be true.
The average score on this problem was 82%.
After fitting our BillyClassifier from the previous
question, we use it to make predictions on an unseen test set. Our
results are summarized in the following confusion matrix.
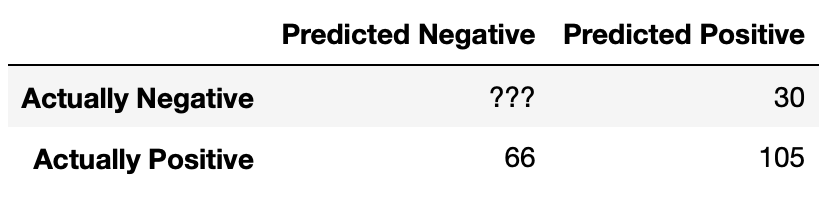
What is the recall of our classifier? Give your answer as a fraction (it does not need to be simplified).
Answer: \frac{35}{57}
There are 105 true positives and 66 false negatives. Hence, the recall is \frac{105}{105 + 66} = \frac{105}{171} = \frac{35}{57}.
The average score on this problem was 89%.
The accuracy of our classifier is \frac{69}{117}. How many true negatives did our classifier have? Give your answer as an integer.
Answer: 33
Let x be the number of true negatives. The number of correctly classified data points is 105 + x, and the total number of data points is 105 + 30 + 66 + x = 201 + x. Hence, this boils down to solving for x in \frac{69}{117} = \frac{105 + x}{201 + x}.
It may be tempting to cross-multiply here, but that’s not necessary (in fact, we picked the numbers specifically so you would not have to)! Multiply \frac{69}{117} by \frac{2}{2} to yield \frac{138}{234}. Then, conveniently, setting x = 33 in \frac{105 + x}{201 + x} also yields \frac{138}{234}, so x = 33 and hence the number of true negatives our classifier has is 33.
The average score on this problem was 84%.
True or False: In order for a binary classifier’s precision and recall to be equal, the number of mistakes it makes must be an even number.
True
False
Answer: True
Remember that \text{precision} = \frac{TP}{TP + FP} and \text{recall} = \frac{TP}{TP + FN}. In order for precision to be the same as recall, it must be the case that FP = FN, i.e. that our classifier makes the same number of false positives and false negatives. The only kinds of “errors" or”mistakes" a classifier can make are false positives and false negatives; thus, we must have
\text{mistakes} = FP + FN = FP + FP = 2 \cdot FP
2 times any integer must be an even integer, so the number of mistakes must be even.
The average score on this problem was 100%.
Suppose we are building a classifier that listens to an audio source (say, from your phone’s microphone) and predicts whether or not it is Soulja Boy’s 2008 classic “Kiss Me thru the Phone." Our classifier is pretty good at detecting when the input stream is”Kiss Me thru the Phone", but it often incorrectly predicts that similar sounding songs are also “Kiss Me thru the Phone."
Complete the sentence: Our classifier has...
low precision and low recall.
low precision and high recall.
high precision and low recall.
high precision and high recall.
Answer: Option B: low precision and high recall.
Our classifier is good at identifying when the input stream is “Kiss Me thru the Phone", i.e. it is good at identifying true positives amongst all positives. This means it has high recall.
Since our classifier makes many false positive predictions — in other words, it often incorrectly predicts “Kiss Me thru the Phone" when that’s not what the input stream is — it has many false positives, so its precision is low.
Thus, our classifier has low precision and high recall.
The average score on this problem was 91%.