← return to practice.dsc80.com
Instructor(s): Justin Eldridge
This exam was administered in-person. The exam was closed-notes, except students were allowed to bring a single two-sided cheat sheet. No calculators were allowed. Students had 80 minutes to take this exam.
Welcome to the Midterm Exam for DSC 80 in Fall 2022!
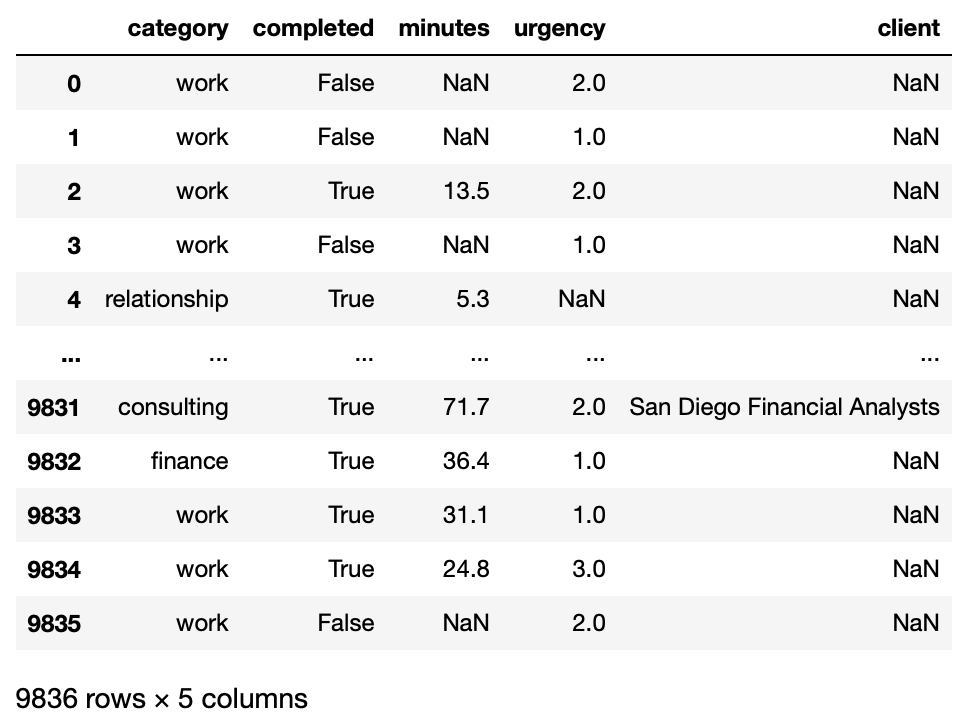
Throughout this exam, we will be using to the following DataFrame
tasks.
Each row of this DataFrame is a recorded task. The columns are as follows:
'category': The category that the task falls into.
E.g., 'work'.'completed': Whether the task has been completed
(True) or not (False).'minutes': The number of minutes that the task took to
complete. Is always missing when the task was not completed, but can
still be missing even if the task was completed.'urgency': A rating of the task’s importance on a scale
from 1 to 3, with 3 being the most important. Some values are
missing.'client': Some of the tasks were performed as part of a
consulting gig. If so, the client that the task was performed for is
listed in this column. Missing values in this column are represented by
the string 'n/a'. You can assume that the client is missing
if and only if the category is not consulting.The table’s index contains unique task identifiers, which are simply
numbers. E.g., the first row’s task identifier is simply
0.
To find out more about the data set, you have run
tasks.info() and performed .value_counts() on
most columns. Here are the results:
>>> tasks.info()
<class 'pandas.core.frame.DataFrame'>
Int64Index: 9836 entries, 0 to 9835
Data columns (total 5 columns):
 #   Column     Non-Null Count  Dtype
---  ------     --------------  -----
 0   category   9836 non-null   object
 1   completed  9836 non-null   bool
 2   minutes    6442 non-null   float64
 3   urgency    8864 non-null   float64
 4   client     1145 non-null   object
dtypes: bool(1), float64(2), object(2)
memory usage: 393.8+ KB

>>> tasks["category"].value_counts(normalize=True)
work            0.562424
relationship    0.136539
consulting      0.116409
hobbies         0.091094
health          0.046157
finance         0.036702
learning        0.010675
Name: category, dtype: float64

>>> tasks["completed"].value_counts(normalize=True)
True     0.654941
False    0.345059
Name: completed, dtype: float64

>>> tasks["urgency"].value_counts(normalize=True)
2.0    0.502595
1.0    0.392825
3.0    0.104580
Name: urgency, dtype: float64

>>> tasks["client"].value_counts(normalize=True)
The Government of Luxembourg    0.224454
San Diego Financial Analysts    0.200873
ABC LLC                         0.196507
SDUSD                           0.191266
NASA                            0.186900
Name: client, dtype: float64What kind of data is in the 'minutes' column in
the tasks DataFrame?
Quantitative
Ordinal
Nominal
Answer: Quantitative
The 'minutes' column is quantitative because it is
numeric and it makes sense to perform calculations with it. For
instance, it would be valid to consider the average minutes spent per
task.
The average score on this problem was 100%.
What kind of data is in the 'urgency' column in
the tasks DataFrame?
Quantitative
Ordinal
Nominal
Answer: Ordinal
The 'urgency' column is ordinal because each task is
“given a rating of a task’s importance on a scale from 1 to 3”, implying
that there is a natural within this column. While one could make the
argument that this column is quantitative, it makes more sense to
categorize each task based on its urgency.
The average score on this problem was 76%.
Define a 'personal' task to be one whose category is not
'work' or 'consulting'.
Write a piece of code which adds a new column named
'personal' to tasks. An entry of the column
should be True if the task is a 'personal'
task, and False otherwise.
Answers:
tasks['personal'] = ~tasks['categorical'].isin(['work', 'consulting'])
or
tasks['personal'] = (tasks['Category'] != 'work') & (tasks['Category'] != 'consulting')
Note that there are many different ways of doing this problem. The
main idea however, is to check whether the category of each task was
considered 'personal' or not, and assign the appropriate
Boolean to the 'personal' column of the given task.
The average score on this problem was 97%.
Write one line of code which returns a Series containing the median number of minutes taken for tasks in each category.
Answer:
tasks.groupby('category')['minutes'].median()
The idea is that we have to groupby 'category' in order
to consider the median number of minutes for each group of tasks based
on their categories. Then we simply aggregate by median()
to get the median of each category. Note that this automatically outputs
the result as a Series so no further code is needed.
The average score on this problem was 89%.
Fill in the code below so that it computes a Series containing, for each category, the proportion of completed tasks which took more than 30 minutes to complete. That is, out of all tasks which were completed in a given category, what percentage took more than 30 minutes?
def proportion_more_than_30(df):
    ____


result = (
    tasks.groupby('category')[['completed', 'minutes']]
    .____(proportion_more_than_30)
)Answer:
return (df[df['completed']]['minutes'] > 30).mean(),
apply
Note that for the first part, there are many different ways to complete this question. The point is that we first want to query for all the completed tasks. Then we get the proportion of all completed tasks that took 30 minutes to complete.
For part 2, if your proportion_more_than_30 function was
implemented correctly, simply calling apply should
suffice.
The average score on this problem was 73%.
Suppose the date of each task has been collected in a Series named , shown below:
>>> dates
7377   2019-08-31
7378   2019-08-31
7379   2019-09-01
7380   2019-09-02
7381   2019-09-02
            ...
9831   2022-10-28
9832   2022-10-29
9833   2022-10-29
9834   2022-10-30
9835   2022-10-30
Length: 2459, dtype: datetime64[ns]
You may assume that the index of dates contains the task
identifier, and that these identifiers correspond to the same
identifiers used in the index of tasks. Note that dates
have only been collected for the last 2459 tasks.
What will happen if we try to run the following line of code?
tasks['date'] = datesA new row will be created with index “date”.
A new column will be created with missing values in the
'date' column for tasks that are not in
dates.
An exception will be raised because some tasks are missing (the size
of dates is not the same as the size of
tasks.)
An exception will be raised because tasks does not have
a column named 'date'.
Answer: Option B
Clearly Option A and D are both wrong so let’s focus our attention to Option B and C.
While C seems like a likely candidate, setting a column to a Series
of different length won’t raise an exception, rather, Python will simply
assign the Series and have missing values for tasks that are not in
dates.
The average score on this problem was 57%.
The code below creates a pivot table.
pt = tasks.pivot_table(
    index='urgency', columns='category', values='completed', aggfunc='sum'
)
Which of the below snippets of code will produce the same result as
pt.loc[3.0, 'consulting']? Select all that apply.
Snippet 1:
tasks[
    (tasks['category'] == 'consulting')
    &
    (tasks['urgency'] == 3.0)
]['completed'].sum()
Snippet 2:
tasks[tasks['urgency'] == 3]
.groupby('category')['completed']
.sum().loc['consulting']
Snippet 3:
tasks.groupby('urgency')['completed']
.sum().loc[3.0, 'consulting']
Snippet 4:
tasks.groupby(['urgency', 'category'])['completed']
.sum().loc[(3.0, 'consulting')]
Snippet 5
tasks.groupby('completed').sum().loc[(3.0, 'consulting')]Snippet 1
Snippet 2
Snippet 3
Snippet 4
Snippet 5
Answer: Option A, B and D
First let’s consider what pt.loc[3.0, 'consulting']
produces. Well pt is a table with urgency as its
'index' and 'category' as its columns. Each
entry in the table is the number of completed task for each
'index', 'category' pairing. Hence
pt.loc[3.0, 'consulting'] produces the number of completed
tasks that are urgency level 3 and category consulting.
Snippet 1: This snippet works because it first querries for all tasks that are urgency 3 as well as category consulting. Then it calculates the number of completed tasks, which is what we wanted.
Snippet 2: This snippet works becuase it first querries for all the tasks that are urgency 3, then groups by category and aggregates the number of completed tasks for each category, and finally returns the number of completed tasks for the consulting category.
Snippet 3: This will not work because we are grouping by urgency and then selecting only the completed column to aggregate. (we are not grouping the categories in any way which is what we want to do in addition to grouping by urgency).
Snippet 4: This will work because we’re grouping by both urgency and category, and aggregating the completed column by sum. This is just a different of writing the pivot_table.
Snippet 5: This will clearly not work because grouping by completed won’t help us here.
The average score on this problem was 76%.
Write a line of code which creates a pivot table showing the number of tasks of each urgency level for each client. The index should contain the urgency levels, and the columns should contain the client names.
Answer: code shown below
tasks.pivot_table(
    columns='client', index='urgency', values='category', aggfunc='count'
)
We’re given that the index should be filled out with
'urgency' and the columns should be 'clients'.
The values should be any other column that has no missing values such as
'category' or 'completed'. The aggfunc is just
count since we want the number of tasks within each
group.
The average score on this problem was 82%.
Suppose that in addition to tasks, you have the
DataFrame named clients, shown below:
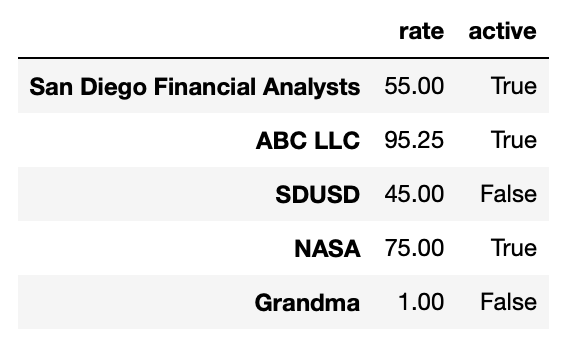
The index of the DataFrame contains the names of clients that have
been consulted for, the 'rate' column contains the pay rate
(in dollars per hour), and the 'active' column says whether
the client is actively being consulted for. Note that the clients which
appear in 'clients' are not exactly the same as the clients
that appear in tasks["client"].value_counts(). That is,
there is a client in tasks["client"] which is not in
clients, and a client that is in clients that
does not appear in tasks.
Fill in the code below so that it produces a DataFrame which has all
of the columns that appear in tasks, but with two
additional columns, rate and activity, listing
the pay rate for each task and whether the client being consulted for is
still active. The number of rows in your resulting DataFrame should be
equal to the number of rows in tasks for which the value in
'client' is in clients.
tasks.merge(
    clients,
    how=___,
    ___,
    ___
)Answer: 'inner',
left_on = 'client, right_index = True
The how parameter in the merge should be set to inner
because we want number of rows in tasks for which the value
in 'client' is in clients, which is a union of
tasks and client. In other words, we want all
the rows that are shared between the two tables, which is just an inner
merge. Since tasks is the left DataFrame for this merge, we want to
merge on the client column of tasks which we
do with left_on = 'client. The corresponding column for
clients in thie merge is just the index, which we do with
right_index = True.
The average score on this problem was 78%.
You observe that tasks in the 'consulting' category seem
to be completed at a higher rate than tasks in the 'work'
category. Could this be due to chance? To check, you’ll run a
permutation test. Your hypotheses are: - Null: The true
probability of completing a 'work' task is the same as the
probability of completing a 'consulting' task. -
Alternative: The true probability of completing a
'consulting' is higher than the probability of completing a
'work' task.
In the box below, write code which performs a permutation test and computes a p-value. The choice of an appropriate test statistic is left to you. You should check 10,000 permutations.
Note: you do not need to do anything special to account for missing values.
Answer: There are multiple ways of doing this problem.
For test statistic, we’ll use the signed difference between the
proportion of 'consulting' tasks which are completed, and
the proportion of 'work' tasks which are completed.
df = tasks[tasks['category'].isin(['work', 'consulting'])]
df = df[['category', 'completed']]

def test_stat(df):
    """Difference in proportion completed: consulting - work."""
    props = df.groupby('category')['completed'].mean()
    return props['consulting'] - props['work']

observed_stat = test_stat(df)

simulated = []
for i in range(10000):
    df['completed'] = np.random.permutation(df['completed'])
    simulated.append(test_stat(df))

p_value = (np.array(simulated) >= observed_stat).mean()
The main things we looked for was that your test statistic computes
the difference in proportion of the two groups (and that it was a signed
difference). We also looked to see if you properly seperated your data
into a 'consulting' group and 'work' group.
Finally, we looked to see that you performed the permutations properly
(by either permuting the 'completed’ column or
'categor' column), as well as calculated a proper
p-value.
The average score on this problem was 82%.
Suppose you wish to perform a permutation test to check the following hypotheses:
What is the best test statistic for this test?
the Kolmogorov-Smirnov statistic
the Total Variation Distance
the signed difference between the mean urgency of completed tasks and the mean urgency of uncompleted tasks
the absolute difference between the mean urgency of completed tasks and the mean urgency of uncompleted tasks
Answer: Option B
Since we’re looking at the distribution of urgencies between two different groups, and urgencies is a categorical variable, it would make the most sense to use TVD here.
The average score on this problem was 90%.
Suppose you are performing a permutation test to check the following hypotheses:
'hobbies' category is drawn from the same distribution as
the time required to complete tasks in the 'finance'
category.'hobbies' category is drawn from a different
distribution as the time required to complete tasks in the
'finance' category.When you plot a histogram for the distribution of times taken to complete tasks in each categories, you see the below:
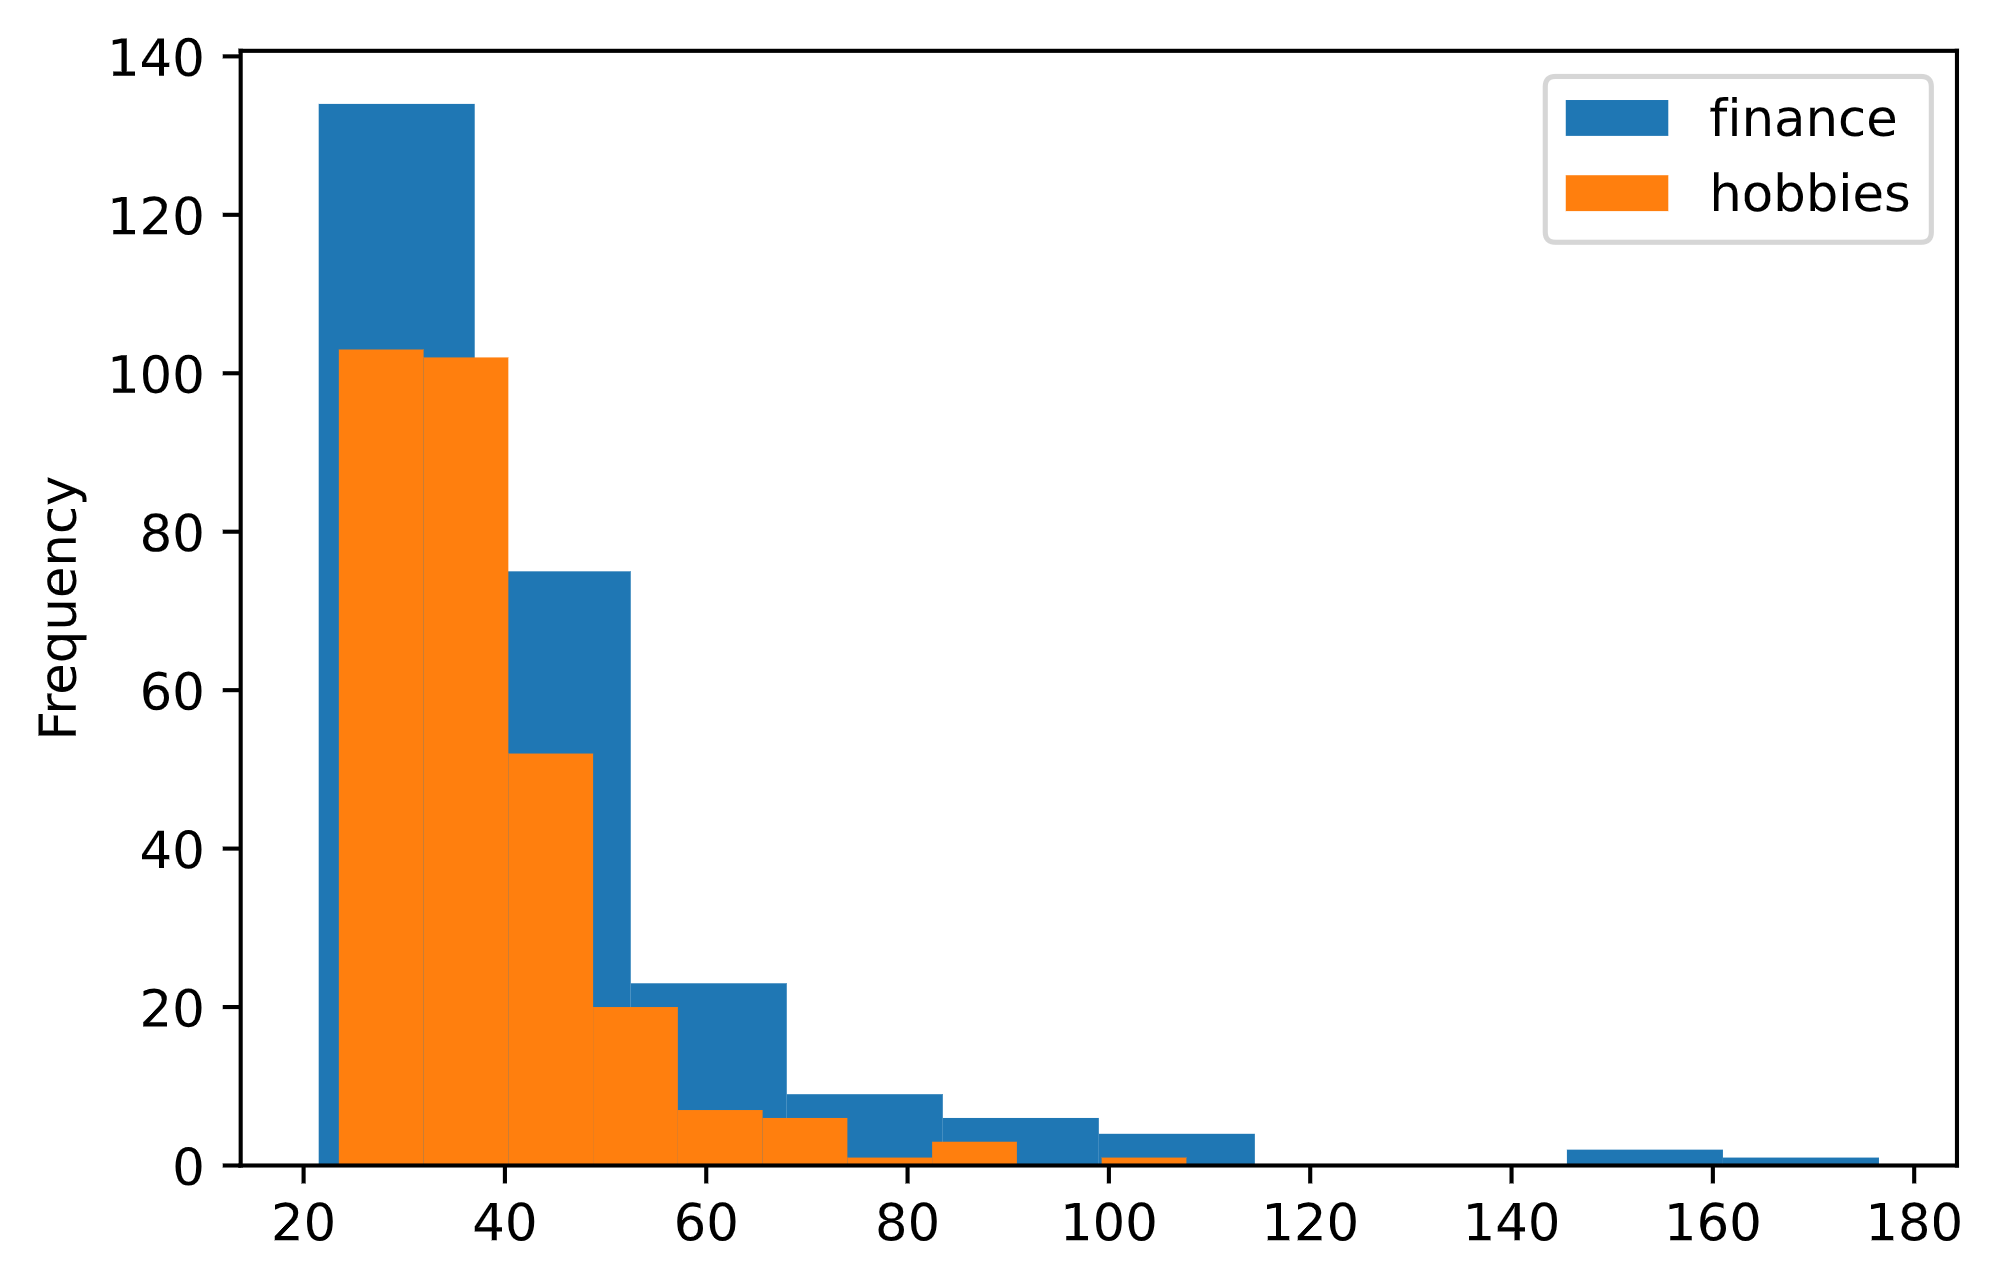
What is the best test statistic for this test?
the Kolmogorov-Smirnov statistic
the Total Variation Distance
the signed difference between the mean time taken for
'finance' tasks, minus the mean time taken for
'hobbies' tasks.
the maximum time taken for 'finance' tasks, minus the
maximum time taken for 'hobbies' tasks
Answer: Option A
Note that TVD doesn’t work well for variables that aren’t categorical so we can rule that out. Looking at the distributions in the graph, it isn’t clear that the difference between the mean time will do much for us, since the means for both distributions seem pretty close in value to each other. Again, looking at the distributions, taking the difference between the max of each group is just a bad metric (plus, max doesn’t really say much about the distribution anyways). Thus using the KS statistic would work best for this problem.
The average score on this problem was 81%.
What is the most likely type of missingness for the missing values in
the ‘client’ column of tasks?
Hint: look at the description of the ‘client’ column at the beginning of the exam for information on when missing values appear.
Missing by Design
Missing Completely at Random
Not Missing at Random
Missing at Random
This question is designed to have a single most likely answer. However, you can optionally provide a justification for your answer below. If your answer above is correct, you will get full credit even if you do not provide justification. However, if your answer above is wrong, you may receive some credit if you provide justification and it is reasonable.
Average: Option A
‘client’ is missing if and only if the category is not
consulting. This means that we can exactly predict when a
value is missing in ‘client’. This is the definition of missing by
design.
The average score on this problem was 61%.
Suppose it is known that the person who collected this data set often neglected to enter an urgency for tasks that they knew would take less than 5 minutes, and that this factor was the most important in the missingness in the ‘urgency’ column.
What is the most likely type of missingness for the missing values in the ‘urgency’ column?
Missing by Design
Missing Completely at Random
Not Missing at Random
Missing at Random
This question is designed to have a single most likely answer. However, you can optionally provide a justification for your answer below. If your answer above is correct, you will get full credit even if you do not provide justification. However, if your answer above is wrong, you may receive some credit if you provide justification and it is reasonable.
Answer: Option D
Because the most important factor in the missingness of values in the ‘urgency’ column is the value in another column, this is MAR.
You might argue that this is NMAR, since tasks which take less than 5 minutes are likely to be less urgent, so there is an association between the uknown urgency and its missingness. However, the main factor is the time required, and so this should be MAR. That is, if we already know the time taken, learning the missing urgency does not provide much more information about the missingness of the urgency. To put it more formally, the probability of missingness conditioned upon the time taken and the uknown urgency is not significantly different from the probability of missingness conditioned only on the time taken.
The average score on this problem was 78%.
Suppose you wish to run a permutation test to determine whether the
missingness in the 'urgency' column is Missing at Random
because of an association with values in the 'category'
column. Which test statistic should be used?
The TVD between the distribution of categories in tasks where the urgency is missing, and the distribution of categories in tasks where the urgency is not missing.
The Kolmogorov-Smirnov statistic between the distribution of categories in tasks where the urgency is missing, and the distribution of categories in tasks where the urgency is not missing.
The TVD between the distribution of urgencies in tasks where the category is missing, and the distribution of urgencies in tasks where the category is not missing.
The Kolmogorov-Smirnov statistic between the distribution of urgencies in tasks where the category is missing, and the distribution of urgencies in tasks where the category is not missing.
Answer: Option A
Note that category and urgency is a categorical variable, so if we’re
going to be looking at the distribution of either one, we’d ideally like
to use TVD. Also, since we’re considering the missigness of
'urgency', the two groups we’re looking at are the
distribution of categories where urgency is missing vs when urgency is
not missing. Thus the right answer is Option A.
The average score on this problem was 91%.
Suppose it is determined that the missingness in the
'urgency' column is Missing at Random due to an association
with the 'category'column, and that tasks in the
'work' category are least likely to be missing an urgency.
You can assume that tasks in the 'work' category have
higher-than-average urgencies.
Suppose the missing urgencies are imputed by randomly sampling from
the observed urgencies. If the mean urgency of tasks in the
'hobbies' category is computed, what is likely to be
true?
It will be unbiased.
It will be biased high (higher than the true average).
It will be biased low (lower than the true average).
Answer: Option B
Since the average urgency of 'work' category tasks is
higher than average, and since 'work' category tasks are
less likely to have a missing urgency value, we conclude that the mean
urgency of tasks will be biased high if we randomly sample from the
observed urgencies.
The average score on this problem was 80%.
Provide an 1 or 2 sentence argument for why the missingness in the
'minutes' column may be Not Missing at Random.
Answer: The person who recorded the tasks may have not bothered to record the time taken by tasks that took a small amount of time.
There were multiple answers that were accepted, so long as the explanation made sense.
The average score on this problem was 94%.