← return to practice.dsc80.com
Instructor(s): Justin Eldridge
This exam was administered in-person. The exam was closed-notes, except students were allowed to bring 5 two-sided cheat sheets. No calculators were allowed. Students had 180 minutes to take this exam.
Welcome to the Final Exam for DSC 80.
This exam has several coding questions. These questions will be manually graded, and your answers are not expected to be syntactically-perfect! Be careful not to spend too much time perfecting your code.
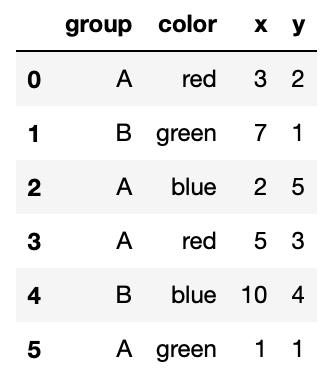
In the next five questions, assume you have access to a DataFrame
named pts, shown below:

What is the type of the result of the following line of code?
pts.groupby('group')['x'].max()
int
float
str
pandas.Series
pandas.DataFrame
Answer: Option D
Calling pts.groupby('group')['x'].max() will return a
Series with the the index consisting of each of the unique groups and a
column containing the max 'x' value within each group.
The average score on this problem was 68%.
Suppose z is a pandas Series containing the data shown
below:
>>> z
5    20
0     1
2     3
Name: z, dtype: int64
Notice that the index of this Series does not match the index of
pts.
Which of the following will be the result of running:
>>> pts['z'] = z
>>> pts
Below are some of the options:
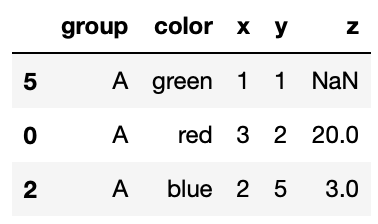
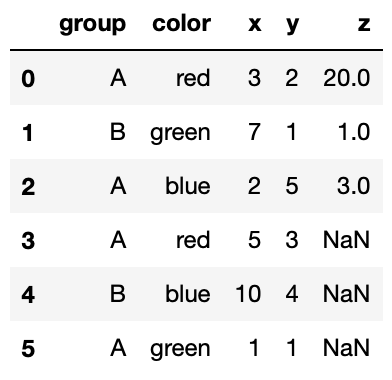
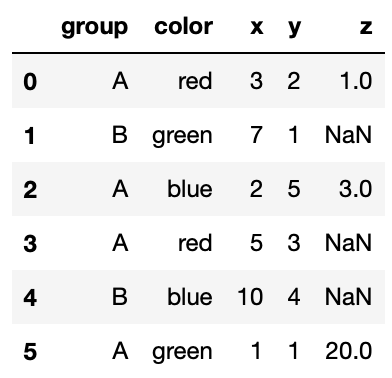
Option 1
Option 2
Option 3
An exception will be raised because z is missing some of
the rows that are in pts.
Answer: Option 3
The code above will simply create a new column 'z', and
match the corresponding value of 'z' with the corresponding
index of 'z' that exists in pts. For the
indeces in pts that aren’t present in 'z',
there will be a NaN value in the appropriate spot in the
'z' column.
The average score on this problem was 97%.
What is the result of the following code?
>>> pivot = pts.pivot_table(
    values='x',
    index='group',
    columns='color',
    aggfunc='count')
>>> pivot.loc['A', 'red']
Your answer should be in the form of a number (or possibly
NaN). Your answer does NOT need to be exactly what is
displayed by Python.
Answer: 2
The pivot table simply counts the number of rows in pts
that have 'group' value ‘A’ AND 'color' value
red, which we could see that there are only two rows that satisfy those
conditions.
The average score on this problem was 70%.
Suppose the costs DataFrame contains the following
data:
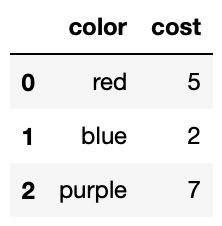
Suppose we run:
>>> res = pts.merge(costs, how='left')How many rows will res have?
Answer: 6
Note that in a left merge, we retain all the rows in the left
DataFrame, regardless of whether or not those rows are shared between
the left and right DataFrames. Thus we also realize that it must be the
case that the resulting merged DataFrame has the same number of rows as
the left DataFrame when performing a left merge. Since
'pts' is the left DataFrame, we’ll be left with 6 rows
after the merge since 'pts' has 6 rows.
The average score on this problem was 95%.
Suppose we have defined:
def foo(ser):
    return (ser - ser.min()).max()
What will be the result of:
>>> pts.groupby('group')[['x', 'y']].aggregate(foo).loc['A', 'x']Your answer should be in the form of a number.
Answer: 4
The foo function essentially takes in a Series, and
returns the difference between the maximum value in the Series and the
minimum value in that same Series.
Thus when we call foo as our aggregate function, we’ll
perform this foo function on the values of each column
within each group. Also, .loc['A', 'x'] means that we just
want get the resulting foo value computed on column ‘x’
within group ‘A’. Focusing our attention on the values of column ‘x’
that are of group ‘A’, we see that the largest value in ‘x’ of group ‘A’
is just 5, and the smallest value is just 1. Therefore our answer is
just 5 - 1 or 4.
The average score on this problem was 90%.
The Earth Impact Database, curated by the University of New
Brunswick’s Planetary and Space Science Centre, contains information on
almost 200 impact craters caused by meteorites that have crashed into
the Earth. In this question, assume you have access to a dataframe named
impacts, shown below:
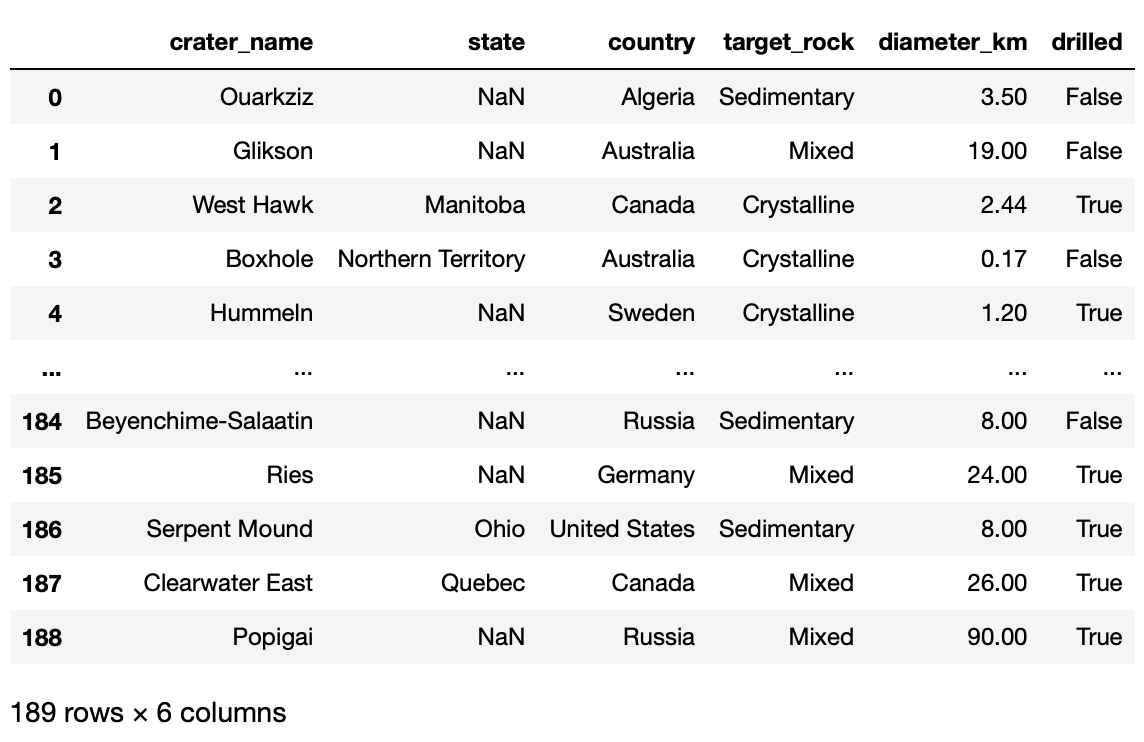
A short description of each column follows:
'crater_name': the name of the impact crater.'state': if the crater is in the United States, the
state containing the crater is listed here; otherwise, it is
missing.'country': the country containing the crater.'target_rock': the type of rock that the crater is
in.'diameter_km': the diameter of the crater in
kilometers.'drilled': whether or not the crater has been drilled
to analyze its contents.There are many missing values in the state column. Upon
inspection, you find that a crater is missing a state if and only if the
crater is not located in the United States. Note: while we’re aware that
upon inspection of the actual DataFrame, that this statement is clearly
not true (such as Canada and Australia), we’ll assume that the statement
is true for the sake of the problem.
What is the most likely type of the missingness in the
statecolumn?
Not Missing at Random (NMAR)
Missing at Random (MAR)
Missing Completely at Random (MCAR)
Missing by Design (MD)
Answer: Option 4
The answer is Missing by Design becuase we can easily predict whether
or not the state column will be missing based on the
country column. Namely, if the country column
is not ‘United States’, then we know that the state column
is missing.
The average score on this problem was 72%.
Suppose we want to test the following hypotheses:
When the distributions of crater diameter are plotted, we see the following:

Which one of the following is the best test statistic in this case?
Total Variation Distance (TVD) between the distributions
Kolmogorov-Smirnov (K-S) distance between the distributions
the signed difference between the mean crater diameter of impacts in sedimentary rock, minus the mean crater diameter of impacts in mixed rock
the unsigned (absolute) difference between the mean crater diameter of impacts in sedimentary rock, minus the mean crater diameter of impacts in mixed rock
Answer: Option C
K-S Statistic doesn’t work well on discrete quantitative variables so we could rule that out. TVD is mainly used with categorical data so we could rule that out (and it’s the absolute value so it wouldn’t tell us whetehr or not one group is larger than the other group). We used the signed difference between mean crater diameter because we want to see whether or not one group is larger than the other, and unsigned difference between mean crater diameter wouldn’t tell us anything about that.
The average score on this problem was 56%.
Suppose it is observed that some values in the column are missing. To
determine if there is an association between this missingness and the
values in the country column, a permutation test will be
performed with the null hypothesis that the distribution of countries
when the diameter is missing is the same as the distribution of
countries when the diameter is not missing.
Which of the following test statistics should be used?
the Total Variation Distance (TVD) between the distribution of countries when the diameter is missing and the distribution of countries when the diameter is not missing
the Kolmogorov-Smirnov statistic between the distribution of countries when the diameter is missing and the distribution of countries when the diameter is not missing
the signed difference between the mean crater diameter of impacts where the country is missing, minus the mean crater diameter of impacts where the country is not missing
the unsigned (absolute) difference between the mean crater diameter of impacts where the country is missing, minus the mean crater diameter of impacts where the country is not missing
Answer: Option A
Since ‘countries’ is a categorical variable, TVD would work the best here.
The average score on this problem was 70%.
Suppose the permutation test described in the previous problem fails
to reject the null hypothesis. Assuming that NMAR and MD have been ruled
out already, what can be said about the missingness in
diameter_km?
it is MCAR
it is MAR
We cannot say for sure without first testing for an association
between the missingness and the other columns besides
country.
Answer: Option C
In order to test whether or not a column is MCAR or MAR, we have to test the missingness of that column against every other column in order to be conclusive about the missingness mechanism. Thus the answer is Option C.
The average score on this problem was 73%.
Suppose we fill in the missing values in the diameter_km
column by random sampling. That is, for each missing diameter, we
randomly sample from the the set of observed diameters. You may assume
that these samples are drawn from the uniform distribution on observed
diameters, and that they are independent.
Assume that it is known that the missingness in the
diameter_km column is MAR. Which of the following is true
about the overall mean of the diameter_km column after
imputation?
It is likely to be an unbiased estimate of the true mean.
It is likely to be a biased estimate of the true mean.
Answer: Option B
Since the missigness mechanism for diameter_km is MAR,
we know that the missigness depends on some other bias from another
column, implying the the observed values are inherently biased. Since
we’re drawing from a biased sample space, we conclude that we’re likely
to generate a biased estimate of the true mean.
The average score on this problem was 81%.
The questions below reference the following HTML.
<html>
    <head>
        <title>ZOMBO</title>
    </head>

    <body>
        <h1>Welcome to Zombo.com</h1>
        <div id="greeting">
            <ul>
                <li>This is Zombo.com, welcome!</li>
                <li>This is Zombo.com</li>
                <li>Welcome to Zombo.com</li>
                <li>You can do anything at Zombo.com -- anything at all!</li>
                <li>The only limit is yourself.</li>
            </ul>
        </div>
        <div id="footnotes" class="faded">
            <h3>Footnotes</h3>

            <ol id="footnotes">
                <li>Please consider <a href="paypal.html">donating!</a></li>
                <li>Made in California with <a href="https://reactj.org">React.</a><li>
            </ol>
        </div>
    </body>
</html>Consider the node representing the body tag in the
Document Object Model (DOM) tree of the above HTML. How many children
does this node have?
Answer: 3
We could count the number of children of the body tag by looking at
the indentations to see that the body tag has three children: 1
<h1> element and 2 <div>
elements.
The average score on this problem was 89%.
The page shown above contains five greetings, each one a
list item in an unordered list. The first greeting is
This is Zombo.com, welcome!, and the last is
The only limit is yourself..
Suppose we have parsed the HTML into a BeautifulSoup
object stored in the variable named soup.
Which of the following pieces of code will produce a list of
BeautifulSoup objects, each one representing a single
greeting list item? Mark all which apply.
soup.find('div').find_all('li')
soup.find_all('li', id='greeting')
soup.find('div', id='greeting').find_all('li')
soup.find_all('ul/li')
Answer: Option A and Option C
Option A works because find('div') will navigate to the
first div element, and find_all('li') will get
all the li elements in the form of a list, which is what we
wanted. Looking at Option C, we could see that it does basically the
exact same thing so that option is correct as well. Option B wouldn’t
work because the li elements don’t have an attribute
‘greetings’, and Option D doesn’t work because there are no
ul/li elements.
The average score on this problem was 85%.
Suppose you perform an HTTP request to a web API using the
requests module. The response succeeds, and you get the
following (truncated) content back:
>>> resp = requests.get("https://pokeapi.co/api/v2/pokemon/squirtle")
>>> resp.content
b'{"abilities":[{"ability":{"name":"torrent","url":"https://pokeapi.co"...
What type of data has been returned?
HTML
JSON
XML
PNG
Answer: JSON
From the format of the contents, we could pretty clearly see that it is not an HTML file, nor is it a PNG file (which is type of image file). Now an XML file also doesn’t look like that, rather it looks more like an HTML file with different kinds of tags. By process of elimination, the answer is JSON.
Alternatively, we could recall that JSON files are in the format of dictionaries of attrivute/value pairs, which is what we see in the contents.
The average score on this problem was 94%.
You are scraping a web page using requests. Your code
has been working fine and returns the desired result, but suddenly you
find that your code takes much longer to finish (if it finishes at all).
It does not raise an exception.
What is the most likely cause of the issue?
The page has a very large GIF that hasn’t stopped playing.
You have made too many requests to the server in a short amount of time
The page contains a Unicode character that requests
cannot parse
The page has suddenly changed and has caused requests to
enter an infinite loop.
Answer: Option B
The average score on this problem was 100%.
In this question, you will be asked to determine which strings are
matched by various regular expression patterns when
re.search is used. For these questions, remember that
re.search(pattern, s) matches s if the pattern
can be found anywhere in s (not necessarily at the
beginning). For example,
re.search("name", "my name is justin") matches, while
re.search("foo", "my name is justin") does not.
Which of the below strings are matched by re.search
using the pattern 'a+'? Select all that apply.
"aa bb cc"
"aaa bbb ccc"
"abaaba"
"abacaba"
**Answer: Option A, B, C and D
The regex pattern 'a+' searches for any string that
contains at least one substring consisting of the character
a one or more times. Clearly all of these strings contain a
substring og the character a one or more times.
The average score on this problem was 98%.
Which of the below strings are matched by re.search
using the pattern 'a+ b+'? Select all that apply.
"aa bb cc"
"aaa bbb ccc"
"abaaba"
"abacaba"
**Answer: Option A and B
The regex pattern 'a+ b+' searches for any string that
contains at least one substring consisting of the character
a one or more times followed by a space followed by the
character b one or more times. The only strings that have
this pattern are Options A and B.
The average score on this problem was 95%.
Which of the below strings are matched by re.search
using the pattern '\baa\b'
Recall that the r at the front of the pattern string
above makes it a “raw” string; this is used so that \b is
not interpreted by Python as a special backspace character.
Select all that apply.
"aa bb cc"
"aaa bbb ccc"
"abaaba"
"abacaba"
**Answer: Option A
The regex pattern '\b' matches for the boundary of a
word (so like the start and end of a word which could seperated by
spaces). Thus the regex pattern searches for the substring
'aa' that is its own standalone word. The only string that
has this pattern is Option A.
The average score on this problem was 75%.
Which of the below strings are matched by re.search
using the pattern '(aba){2,}'? Select all that apply.
"aa bb cc"
"aaa bbb ccc"
"abaaba"
"abacaba"
**Answer: Option C
The regex pattern '(aba){2,}' searches the substring
consisting of aba 2 or more times. The only string that has
this pattern is Option C.
The average score on this problem was 97%.
Which of the below strings are matched by re.search
using the pattern 'a..a'? Select all that apply.
"aa bb cc"
"aaa bbb ccc"
"abaaba"
"abacaba"
**Answer: Option C
The regex pattern 'a..a' searches the substring
consisting of a followed by any two characters followed by
a. The only string that has this pattern is Option C.
The average score on this problem was 99%.
Which of the below strings are matched by re.search
using the pattern '.*'? Select all that apply.
"aa bb cc"
"aaa bbb ccc"
"abaaba"
"abacaba"
**Answer: Option A, B, C and D
The regex pattern '.*' searches the substring consisting
of any character 0 or more times. Clearly all of the strings contain
that pattern.
The average score on this problem was 100%.
Consider the following four sentences:
Suppose these sentences are encoded into a “bag of words” feature representation. The result is a dataframe with four rows (one for each sentence). How many columns are in this dataframe? Your answer should be in the form of a number.
Answer: 8
Recall that bag of word creates a new column for each unique word. Thus the problem boils down to “how many unique words are there in the following four sentences”, which we count 8: “this”, “is”, “one”, “two”, “the”, “third”, “and”, “fourth”.
The average score on this problem was 98%.
Again consider the same four sentences shown above.
What is the TF-IDF score for the word “this” in the first sentence? Use base-2 logarithm.
Your answer should be in the form of a number.
Answer: 0
Recall that TF is calculated as the number of terms that appear in that sentence divided by the total number of terms in the sentence. In this case the TF value of “this” in the first sentence is \frac{1}{3}.
IDF is calculated as the log of the number of sentences divided by the number of sentences in which that term appears in. In this case, the IDF value of “this” in the first sentence is \log_{2}(\frac{4}{4}) = 0.
Thus the TF-IDF is just \frac{1}{3} * 0 = 0
The average score on this problem was 97%.
Again consider the same four sentences shown above.
What is the TF-IDF score for the word “and” in the last sentence? Use base-2 logarithm.
Your answer should be in the form of a number.
Answer: 0.4
Recall that TF is calculated as the number of terms that appear in that sentence divided by the total number of terms in the sentence. In this case the TF value of “and” in the last sentence is \frac{1}{5}.
IDF is calculated as the log of the number of sentences divided by the number of sentences in which that term appears in. In this case, the IDF value of “and” in the last sentence is \log_{2}(\frac{4}{1}) = 2.
Thus the TF-IDF is just \frac{1}{5} * 2 = 0.4
The average score on this problem was 89%.
Consider the dataframe shown below:

Suppose you wish to use this data in a linear regression model. To do
so, the color column must be encoded numerically.
True or False: a meaningful way to numerically encode the
color column is to replace each string by its index in the
alphabetic ordering of the colors. That is, to replace “blue” by 1,
“green” by 2, and “red” by 3.
True
False
Answer: False
Note that color is a nominal categorical varaible,
meaning that there is no inherent ordering to the categories. Thus
encoding the color variables by 1, 2, and 3 doesn’t make
any meaningful sense. I.e. it doesn’t make sense to think of the color
“red” as being “greater” than the color “blue” in any meaningful
way.
The average score on this problem was 88%.
Suppose you perform a one-hot encoding of a Series containing the following strings:
["red", "blue", "red", "green", "green", "purple", "orange", "blue"]}
Assume that the encoding is created using the
OneHotEncoder(drop='first') from sklearn. Note
the drop='first' keyword argument: skearn’s
documentation says that this will “drop the first category in each
feature.”
How many columns will the resulting one-hot encoding table have?
Answer: 4
Recall that One-Hot Encoding will create a new column for each unique
term in the group of strings. Thus “normal” One-Hot Encoding will create
5 columns, since there are 5 distinct words in the list of strings:
“red”, “blue”, “green”, “purple” and “orange”. However, setting
drop='first' will drop one of the columns, leaving us with
4 columns.
The average score on this problem was 88%.
The next four questions concern the following example.
A Silicon Valley startup candy company buys a factory from a lightbulb company and repurposes some of the existing equipment to make chocolate bars with the goal of disrupting the candy industry. Their IPO is delayed, however, when they discover that some of their chocolate bars contain broken glass.
The company’s engineers quickly build an AI which looks at the chocolate bars coming off of the conveyor belt and predicts which bars contain broken glass (“yes”) and which don’t (“no”). The results are shown in the following confusion matrix:

What is the accuracy of their model as a percentage (between 0% and 100%)?
Answer: 91%
The accuracy of a model is given by the number of correct predictions divided by the total number of predictions. To tell if a prediction is correct, we simply see if the predicted value matches the actual value. In this case, our model’s accuracy is just \frac{87+4}{87+6+3+4} = \frac{91}{100} which is just 91%.
The average score on this problem was 95%.
What is the recall of their model as a percentage (between 0% and 100%)?
Answer: 40%
The recall of a model is given by the number of True Positives divided by the sum of True Positives and False Negatives. A True Positive is when the model correctly predicts a Positive value (in this case, a Positive value is “Yes”), and a False Negative is when a model incorrectly predicts a Negative value. Thus the answer is just \frac{4}{6+4} = \frac{4}{10} which is just 40%.
The average score on this problem was 92%.
From a safety perspective, which metric should be maximized in this situation?
Precision
Recall
Answer: Recall
From a safetly perspective, it makes sense that we should maximize catching broken glass in the chocolate bars. This means that we should minimize False Negative values, which means maximizing Recall.
The average score on this problem was 100%.
Suppose the company’s investors wish to improve the model’s precision. Which should they do (besides hire better data scientists)?
Lower their model’s threshold for predicting that a bar contains glass, thus throwing out more candy.
Raise their model’s threshold for predicting that a bar contains glass, thus throwing out less candy.
Answer: Option B
The precision of a model is given by the number of True Positives divided by the sum of True Positives and False Positives. Thus to maximumize the precision of a model, we should minimize the number of False Positives. To do this, simply raising the model’s threshold for predicting Positive values would result in less False Positives. Thus the answer is Option B.
The average score on this problem was 97%.
Suppose you split a data set into a training set and a test set. You train a classifier on the training set and test it on the test set.
True or False: the training accuracy must be higher than the test accuracy.
True
False
Answer: False
There is no direct correlation between the training accuracy of a model and the test accuracy of the model, since the way you decide to split your data set is largely random. Thus there might be a possibility that your test accuracy ends up higher than your training accuracy. To illustrate this, suppose your training data consists of 100 data points and your test data consists of 1 data point. Now suppose your model achieves a training accuracy of 90%, and when you proceed to test it on the test set, your model predicts that singular data point correctly. Clearly your test accuracy is now higher than your training accuracy.
The average score on this problem was 97%.
Suppose you are using sklearn to train a decision tree
model to predict whether a data science student is enrolled in DSC 80 or
not based on several pieces of information, including their hours spent
coding per week and whether or not they have heard of the
Kolmogorov-Smirnov test statistic.
Suppose you train your model, but achieve much lower training and test accuracies than you expect. When you look at the data and make predictions yourself, you are easily able to achieve higher train and test accuracies.
What should be done to improve the performance of the model?
Decrease the max_depth hyperparameter; the model is
“overfitting”.
Increase the max_depth hyperparameter; the model is
“underfitting”.
Answer: Option B
The fact that your model has a low training accuracy means that your
model is not complex enough to capture the trends that are present in
the data and thus likely “underfitting”. This means that you should
increase the max_depth parameter.
The average score on this problem was 73%.