
← return to practice.dsc80.com
Instructor(s): Justin Eldridge
This exam was administered online. The exam was open-internet. Students had 80 minutes to take this exam.
Coding Questions
This exam has several coding questions. These questions will be manually graded, and your answers are not expected to be syntactically-perfect! Be careful not to spend too much time perfecting your code.
You may of course run any code you like during the exam, but doing so very often may cause you to run out of time. The exam is designed so that you do not need to run any code.
Point Distribution
Every question below is worth 1 point, except for:
Partial credit is not possible for 1 point questions unless otherwise stated, but it is available for the coding questions. Budget your time accordingly!
The Data Set
The table below shows data collected for 330 penguins in Antarctica.
Each row represents one penguin. Three species of penguins appear in the
data set: “Adelie”, “Gentoo”, and “Chinstrap”. This data set will be
referred to throughout the exam as the DataFrame df.

What kind of data is in the column named “Species”?
quantitative
nominal
ordinal
Answer: nominal
From the dataset, it is clear that the "species"
attribute of each row is qualitative, and since there is no inherent
order in the "species" of each penguin, we conclude that
the "species" column is nominal.
The average score on this problem was 97%.
What kind of data is in the column named
"Body Mass (g)"?
quantitative
nominal
ordinal
Answer: quantitative
From the dataset it is clear that "Body Mass" is
quantitative because it is numerical and it makes sense to perform
calculations with respect to "Body Mass". For instance, we
could calculate average body mass per species.
The average score on this problem was 98%.
The code below produces a new table. How many rows will the table have? (See the data set description above for useful information).
df.groupby('Species')['Culmen Length (mm)'].aggregate([np.mean, np.median])Answer: 3
We’re grouping the dataset by "Species", so our
resulting table will have 3 rows since there are 3 unique species in the
dataset. Note that aggregating by multiple functions won’t affect the
number of rows in the output dataset, rather it will change the number
of columns in the resulting table.
The average score on this problem was 94%.
The following function accepts a series of numbers and returns a series of the same size in which every number has been standardized (also known as “z-scored”):
def standardize(ser):
    return (ser - ser.mean()) / ser.std()
Which of the following lines of code will return a series of
standardized flipper lengths of length 330 (same as the number of rows
in df), where the standardization is done within each
species? That is, the flipper sizes of Adelie penguins are
standardized as a group, the flipper sizes of Gentoo penguins are
standardized as another group, and so on.
df.groupby('Species')['Flipper Length (mm)'].transform(standardize)
df.groupby('Species')['Flipper Length (mm)'].aggregate(standardize)
df.groupby('Species')['Flipper Length (mm)'].standardize()
df.groupby('Species')['Flipper Length (mm)'].agg(standardize)
Answer: Option A
Option A: We want to standardize the flipper length of EACH penguin within each group. This is done using the transform function and applying the standardize fucntion. Option B: Aggregate is used to generate a singular value for each group (so like count of each species for example), not to apply a function to each column within each group. Option C: We can’t directly call the function standardize as our aggregate function. Option D: This doesn’t work for the same reason as Option B.
The average score on this problem was 93%.
Suppose incomplete data is collected on three new penguins, shown below:

Call this DataFrame df_incomplete, and note that there
are fewer columns than in df and that the columns which do
appear are in a different order.
Suppose df_incomplete is appended to the end of
df with the code
pd.concat([df, df_incomplete]). What will be the values in
the last line of the resulting DataFrame?
[197, 19.5, 'Adelie', nan, nan, nan, nan] with row label
(index) 2
[nan, 19.5, 197.0, nan, nan, nan, 'Adelie'] with row
label (index) 2
[0, 19.5, 197.0, nan, nan, nan, 'Adelie'] with row label
(index) 2
[197, 19.5, 'Adelie', 0, 0, 0, 0] with row label (index)
2
[197, 19.5, 'Adelie', nan, nan, nan, nan] with row label
(index) 332
[nan, 19.5, 197.0, nan, nan, nan, 'Adelie'] with row
label (index) 332
[0, 19.5, 197.0, 0, 0, 0, 'Adelie'] with row label
(index) 332
[197, 19.5, 'Adelie', 0, 0, 0, 0] with row label (index)
332
Answer: Option B
Concatting the incomplete DataFrame to df will
essentially “match” the columns of the incomplete DataFrame to the
corresponding columnd in df. (So ‘Species’ in the
incomplete DataFrame will be matched to the ‘Species’ column in
df). For the values that don’t exist in the incomplete
DataFrame, python will just fill the missing values with
nan. Finally, the index row label still stays as 2.
The average score on this problem was 97%.
Suppose a penguin is considered “little” if its body mass is less
than 3250 grams. Write a piece of code that computes the number of each
species which are considered little. Your code should return a series.
To receive full credit, your code should not modify the dataframe
df.
Note: your code will be graded manually, and it is not expected to be perfect. Be careful to not spend too much time trying to make your code perfect!
Answer:
df.loc[df['Body Mass'] < 3250].groupby('Species').count()Note that there are many different approaches to this question. You can filter the DataFrame for “little” penguins first and then groupby (such as the code above). You could create an “indicator” column that indicates whether each penguin is “little” or not and sum that column for each group using group by again. You can create a custom aggregator, among other solutions.
The average score on this problem was 89%.
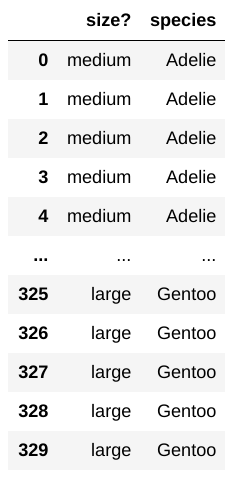
Suppose you have created a new table by_size which lists
each penguin’s size as either “small”, “medium”, or “large”. The species
is also included. The table looks like this:
Using the code
by_size.pivot_table(index='species', columns='size?', aggfunc='size'),
you’ve created the pivot table shown below:
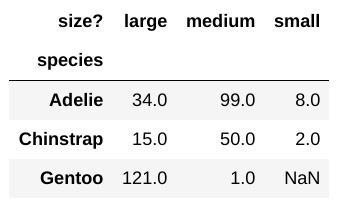
There is a NaN in this pivot table. Why?
some Gentoo penguins had sizes that were NaN
some Gentoo penguins had sizes that were not strings
there were too many small Gentoo penguins for the computer to represent with finite precision
there were no small Gentoo penguins
Answer: Option D
We can think of a pivot table as a fancy reorganized group by that
just lists every combination pair of ‘species’ and ‘size’. Now the
reason why’d there be a NaN in the pivot table is because
there are no small Gentoo penguins. The reason this is NaN,
rather than some other value (like 0) makes more sense if we consider it
through the lens of a group by. In a group by, when we group by
species and size and aggregate by some
function, we get some value associated with each group PRESENT in the
DataFrame. In group by, when a group doesn’t exist, it simply doesn’t
show up (instead of having 0 as a value for instance). Thus the answer
is D.
The average score on this problem was 95%.
Suppose we wish to fill in the missing value in the pivot table above. What makes the most sense to fill it in with?
0
1
np.inf (infinity)
the mean of the "small" column
the mean of the “Gentoo” row
a number chosen at random from the observed values in the
"small" column
a number at random from the uniform distribution on [0, 1]
Answer: 0
As explained in the solution of Q7. Since there were no Gentoo Small penguins, it makes sense to fill in the missing value of the pivot table with 0.
The average score on this problem was 93%.
You have a second dataframe, personalities, that
contains the disposition and intelligence of several species of
penguin:
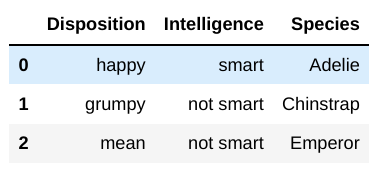
Note that personalities is missing some of the species
that are in df, and it contains species that are
not in df.
You’d like to use the table to add columns to df for the
disposition and intelligence of each of the penguins in the data set. If
a species in df is not listed in
personalities, you’re OK with having their disposition and
Intelligence be NaN. And if a species in
personalities is not in df, it should not be
added. Therefore, the result of your merge should have exactly 330 rows
– the same as df.
Which of the below will perform this?
pd.merge(df, personalities, how='outer')
pd.merge(df, personalities, how='inner')
pd.merge(df, personalities, how='left')
pd.merge(df, personalities, how='right')
Answer: Option C
Since we want our resulting DataFrame to have the same number of rows
as df, which is our left dataframe, we simply just perform
a left merge which is Option C. Right merge and outer merge are wrong
since there are some species in personalities not in
df, and inner merge wouldn’t work since there are some
species in df not in personalities.
The average score on this problem was 93%.
In the sample of penguins in the table df above, 40% are
Gentoo penguins, 30% are Adelie, and 30% are Chinstrap. It is known
that, overall, 45% of penguins in Antarctica are Gentoo, 35% are Adelie,
and 20% are Chinstrap. It therefore seems that the distribution of
penguin species in your sample may differ from the population
distribution.
You will test this with a hypothesis test. Your null hypothesis is
that the sample in df was drawn at random from the
population. The alternative hypothesis is that your sample was drawn
with different probabilities than those shown above.
Write a piece of code to calculate the p-value of the observed data. You must choose a test statistic, calculate the observed value of the test statistic, compute simulated values of the test statistic, and calculate a p-value. For that reason, this question is worth 7 points, and partial credit will be awarded for each of the above.
Note: your code will be graded manually, and it is not expected to be perfect. Be careful to not spend too much time trying to make your code perfect!
Answer:
observed = (abs(0.45 - 0.4) + abs(0.35 - 0.3) + abs(0.3 - 0.2)) / 2
arr = []
for i in range(1000):
    sample = np.random.multinomial(330, p = [0.45, 0.35, 0.2]) / 330
    test_stat = sum(abs(sample - np.array([0.4, 0.3, 0.3]))) / 2
    arr += [test_stat]

p_value = sum(np.array(arr) >= observed) / 1000
Note that there were many different ways to do this problem. The main
things we looked for were: whether or not you used TVD as your test
statistic, whether or not you computed an observed test statistic
correctly, generated samples using np.random.multinomial or
np.random.choice, and calculated your p-value
correctly.
The average score on this problem was 83%.
Suppose you look at the distribution of culmen (beak) depth for each species and find the following:
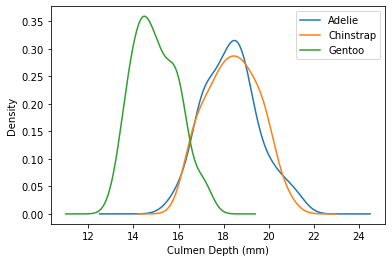
It looks as though Chinstrap penguins have larger culmen depth than Gentoo penguins. Which of the following test statistics could be used to test this alternative hypothesis against the null hypothesis that the two distributions are the same? Check all that apply.
TVD
Kolmogorov-Smirnov
signed difference in mean culmen depth
unsigned difference in mean culmen depth
Answer: Option C
Note that from the image, we notice that the shape of the distribution of culmen depth for Chinstrap and Gentoo are pretty similar. The main difference is the location (ie the Gentoo distribution seems to be shifted to the left). Thus an appropriate test statistic would be the signed difference in mean culmen depth. We used the signed difference because we want to test whether Chinstrap penguins have LARGER culmen depth, not whether or not they have different culment depths.
The average score on this problem was 38%.
Suppose you now look at the distribution of culmen depth for each species once more and again find the following:

What test statistic is the best choice for testing whether the empirical distributions of culmen depth in Chinstrap and Adelie penguins came from different underlying distributions?
the Kolmogorov-Smirnov Statistic
the absolute difference in means
the TVD
the signed difference in means
Answer: Option A
Since the distribution of culmen depth are more or less the same and they are stacked on top of each other (meaning that the location of the distributions are pretty close to each other), it would make the most sense to use KS statistic. We wouldn’t be able to used the difference in means because, again, the means of the distribution look to be able the same and we want to see if there is a different distribution of culmen depth. Furthermore, TVD wouldn’t work well since culmen depth is a continuous quantitative varaible.
The average score on this problem was 89%.
Suppose some of the entries in the "Body Mass (g)"
column are missing.
Body mass measurements were taken any time a penguin walked across a scale that was placed outside. In your experience, the scale sometimes fails to make a measurement if the item placed on top is too small.
What is the most likely type of missingness in this case?
Missing Completely at Random
Missing at Random
Not Missing at Random
Missing by Design
Below, you may optionally provide justification for your answer. If your answer above is correct, you will get full credit even if you do not provide justification. However, if your answer above is wrong, you may receive some credit if you provide justification and it is reasonable.
Answer: Option C
The answer is NMAR since the missigness of the values depend on the value itself, namely, the value would most likely be missing for smaller body mass penguins because the scale wouldn’t be able to make a measurment “if the item placed on top is too small”.
The average score on this problem was 88%.
Suppose some of the entries in the "Delta 15 N (o/oo)"
and "Delta 13 C (o/oo)" columns are missing.
The measurements above were taken by four different teams located at different places in Antarctica, and one of the teams had a faulty measurement device that prevented them from measuring “Delta 15 N” and “Delta 13 N”. The penguins in this team’s area were mostly Gentoo penguins.
What is the most likely type of missingness in this case?
Missing Completely at Random
Missing at Random
Not Missing at Random
Missing by Design
Below, you may optionally provide justification for your answer. If your answer above is correct, you will get full credit even if you do not provide justification. However, if your answer above is wrong, you may receive some credit if you provide justification and it is reasonable.
Answer: Option B
The answer is MAR because knowing the species of the penguin species gives you information on whether the measurements are missing or not, namely, Gentoo penguins are more likely to have missing measurments.
The average score on this problem was 81%.
Suppose some of the entries in the "Flipper Length (mm)"
column are missing.
It is very hard to measure the flipper length of a wild penguin because penguins have a tendency to run away whenever you approach them with a ruler. For this reason, the researchers agree that they will only measure the flipper length of half of the penguins they see. To implement this, they flip a coin when they see a penguin – if the coin comes up heads, they measure the penguin’s flipper length, and if it is tails they leave the flipper length blank.
What is the most likely type of missingness in this case?
Missing Completely at Random
Missing at Random
Not Missing at Random
Missing by Design
Below, you may optionally provide justification for your answer. If your answer above is correct, you will get full credit even if you do not provide justification. However, if your answer above is wrong, you may receive some credit if you provide justification and it is reasonable.
Answer: Option A
The answer is MCAR since the flipping of the coin is a random decider that will determine whether a penguin will have a missing measurment or not.
The average score on this problem was 87%.
Suppose some of the body masses are missing. You’d like to test if some of the body masses are missing at random (MAR) dependent on the species. You will determine this with a permutation test. Which one of the below is a valid test statistic for this test?
the TVD (total variation distance)
the K-S statistic (Kolmogorov-Smirnov)
the absolute (unsigned) difference in means
the signed difference in means
Answer: Option A
Another way to think of this question, is that we’re looking at the distribution of species for missing body masses vs distribution of species for non-missing body masses. And since species is a qualitative variable, TVD would work well as a test statistic.
The average score on this problem was 38%.
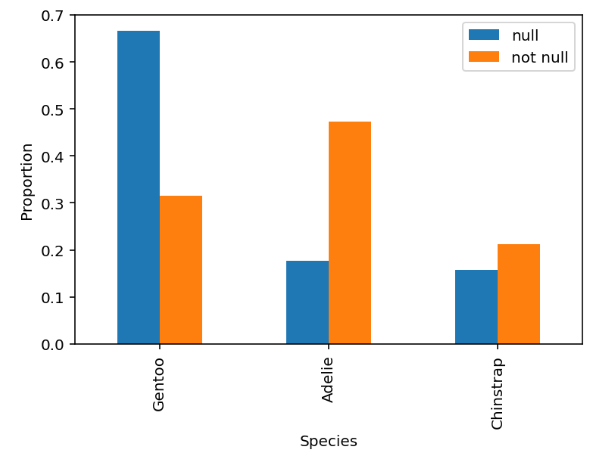
Suppose the "Flipper Length (mm)" column has missing
values. The distributions of species when the flipper length is missing
(null) and when it is present (not null) are shown below:
Futhermore, the average flipper length of each species is as follows:
>>> df.groupby('Species')['Flipper Length (mm)'].mean()
Species
Adelie       190.290780
Chinstrap    195.671642
Gentoo       217.147541
Name: Flipper Length (mm), dtype: float64
Suppose the overall mean flipper length is computed (using only the observed values). Which of the following is true?
the mean will be biased high
the mean will be biased low
the mean will be unbiased
Answer: Option B
Notice from the graph that Gentoo has a disproportionately high number of missing values. And since Gentoo flipper length is higher than average, the overall mean computed will be lower than the actual mean, meaning that the mean will be biased low.
The average score on this problem was 68%.
Write a piece of code that imputes missing flipper lengths with the median flipper length of the species that the penguin belongs to.
Note: your code will be graded manually, and it is not expected to be perfect. Be careful to not spend too much time trying to make your code perfect!
Answer:
df.groupby('Species')['Length'].transform(lambda x: x.fillna(x.median()))
The average score on this problem was 84%.